Ferrosilicon Market Outlook:
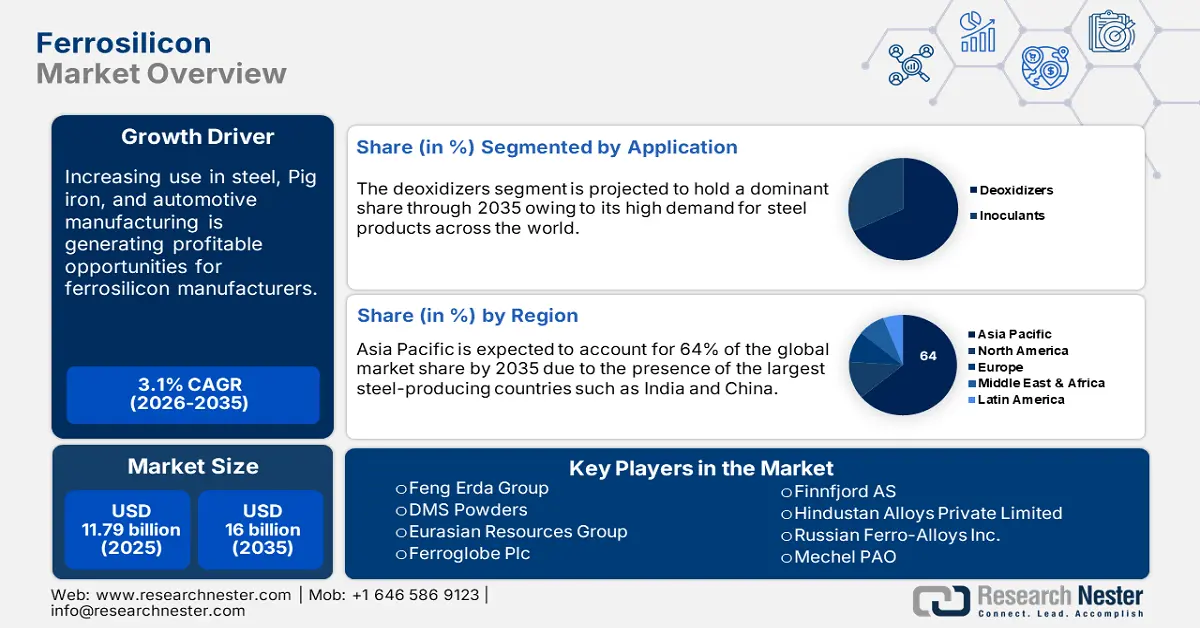
Ferrosilicon Market size was over USD 11.79 billion in 2025 and is anticipated to cross USD 16 billion by 2035, witnessing more than 3.1% CAGR during the forecast period i.e., between 2026-2035. In the year 2026, the industry size of ferrosilicon is assessed at USD 12.12 billion.
The ferrosilicon market is marked by expanding end users and the consecutive rise in production. The U.S. silicon production was 22,100 metric tons (t) in September 2024 compared with 21,900 t in August 2024 and the net shipments accounted for 15,400 t in September 2024. The ending stocks were 20,600 t by September 2024, a steady surge from the previous month. The total ferrosilicon imports in September 2024 were 6,040 t and overall silicon metal imports were 13,500 t, a 47% spike from August 2024, a double from September 2023. The key export destinations of 99.9% silicon metal as per USGS include Vietnam (1,600 tons), Japan (378 tons), and Taiwan (283 tons) and 55-80% grade exports were to India (1,500 tons), Canada (1,090 tons), and Vietnam (562 tons).
The U.S. production, stocks, and shipments of silicon alloys and metals (through 2024)
|
Year to date |
Gross production |
Net shipments |
Producers' stocks, end of period |
|
2023 |
|
|
|
|
September |
W* |
W |
22,600 |
|
October |
28,700 |
W |
22,900 |
|
November |
26,300 |
20,500 |
22,000 |
|
December |
W |
20,100 |
20,400 |
|
Jan-Dec |
W |
245,000 |
20,400 |
|
Jan-Sep |
W |
W |
22,600 |
|
2024 |
|
|
|
|
January |
W |
24,200 |
17,500 |
|
February |
W |
W |
17,700 |
|
March |
W |
W |
18,800 |
|
April |
W |
W |
19,900 |
|
May |
W |
21,600 |
20,700 |
|
June |
W |
18,400 |
20,800 |
|
July |
W |
18,900 |
21,800 |
|
August |
21,900 |
W |
20,100 |
|
September |
22,100 |
15,400 |
20,600 |
|
Jan-Sep |
W |
179,000 |
20,600 |
Source: USGS; W*-Withheld to avoid disclosing
Barium titanate, gallium, and germanium are the leading raw materials used in ferrosilicon and its alloys. Being a critical material, titanium was priced at USD 11 per kilogram in 2022. In smaller consumer electronics, its ferrosilicon concentration is 0.1332 w/w% and it is relatively dispersed. In acoustic devices, it is found as barium titanate and is used as a barrier coating in ICs. Presently, titanium recovery is not economically appealing. Specialized devices such as MRI magnets have 37 w/w% titanium concentration, with a lifetime of over ten years, thereby generating less waste. 2024 file report by USGS suggests that China dominates the gallium and germanium global supply chain, positioning itself as crucial for global players.
The U.S. Geological Survey estimates quantify the potential aftermath of mineral commodity supply chain disruptions from net import restrictions on gallium and germanium on the U.S. GDP. The results indicated that total restriction on gallium and germanium imports from China could result in a slump in the U.S. GDP of USD 3.1 billion or 0.013% of the total GDP. 46.5%, nearly half of the setback would be semiconductor and connected device manufacturing, which has a high dependency on gallium. As per OEC, the worldwide trade of germanium (comprising germanium oxides and zirconium dioxide) accounted for USD 484 million, exhibiting a 7% export growth rate. China alone was valued at USD 180 million, capturing a 37.1% export share and the U.S. import value was USD 61.5 million, with an import share of 12.7%.
In terms of ferrosilicon trade, the value totaled USD 6.15 billion in 2022 and was the world’s 630th most imported/exported item out of 4648. The export CAGR was a whopping 37.6%, making China an evident leader with USD 1.34 billion worth of exports. Between 2021 and 2022 the Ferro-silicon, >55% silicon global outbound trade rose to USD 6.15 billion from USD 4.47 billion. After China, Russia (USD 830 million), Norway (USD 555 million), Malaysia (USD 425 million), and Brazil (USD 419 million) were key exporters. Whereas, Japan (USD 926 million), the U.S. (USD 829 million), Germany (USD 456 million), South Korea (USD 410 million), and the Netherlands (USD 398 million) were the top importers of ferrosilicon.
Key Ferrosilicon Market Insights Summary:
Regional Highlights:
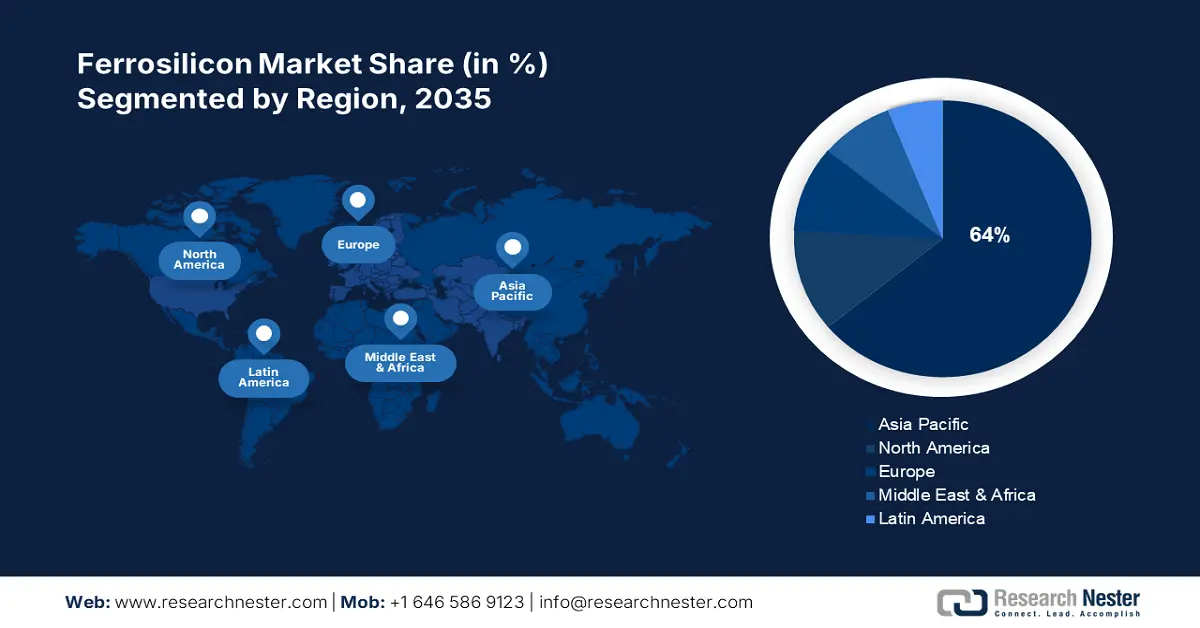
- Asia Pacific ferrosilicon market will secure around 64% share by 2035, driven by presence of top steel producers, modernization, and infrastructure development.
- North America market will experience staggering growth during the forecast timeline, driven by rising demand for stainless steel and domestic production support policies.
Segment Insights:
- The stainless steel segment in the ferrosilicon market is expected to capture a significant share by 2035, driven by stainless steel’s durability, recyclability, and wide use in household appliances, kitchenware, and medical instruments.
- The deoxidizers segment in the ferrosilicon market market will capture the majority market share, driven by rising global steel demand with over 90% of annual ferrosilicon production used for deoxidation in steelmaking and smelting, forecast year 2035.
Key Growth Trends:
- Massive growth in the steel industry and pig iron production
- Demand from the automotive sector
Major Challenges:
- A gradual shift away from pig iron and scrap steel to decouple from import risks
Key Players: Feng Erda Group, DMS Powders, Eurasian Resources Group, Ferroglobe PLC, Finnfjord AS, Hindustan Alloys Private Limited, Russian Ferro-Alloys Inc., Mechel PAO, OM Holdings Ltd., Westbrook Resources Ltd.
Global Ferrosilicon Market Forecast and Regional Outlook:
Market Size & Growth Projections:
- 2025 Market Size: USD 11.79 billion
- 2026 Market Size: USD 12.12 billion
- Projected Market Size: USD 16 billion by 2035
- Growth Forecasts: 3.1% CAGR (2026-2035)
Key Regional Dynamics:
- Largest Region: Asia Pacific (64% Share by 2035)
- Fastest Growing Region: Asia Pacific
- Dominating Countries: China, Russia, India, United States, Germany
- Emerging Countries: China, India, Japan, South Korea, Thailand
Last updated on : 10 September, 2025
Ferrosilicon Market Growth Drivers and Challenges:
Growth Drivers
- Massive growth in the steel industry and pig iron production: Integrated mills and minimills are the two primary types of steel production in the U.S. Integrated mills produce steel raw materials like iron ore and deoxidize it using ferrosilicon, and minimills use electric arc furnaces make steel from ore-based metallics and steel scrap in the form of direct reduced iron and pig iron. Roughly 70% of steel produced in the U.S. is highly reliant on imported pig iron and made in minimills. Based on the steel specifications produced, electric arc furnaces may need to mix 20-90% metallics with the scrap steel in a furnace charge. While integrated steel mills make their own pig iron, minimills are usually reliant on merchant pig iron purchased from foreign entities.
In the U.S., most of the material is purchased from Ukraine, Russia, and Brazil. In 2021, the worldwide pig iron production was 1.4 billion metric tons and China amounted to 64% of overall production and consumption. China produced 869 million metric tons (MMT) of pig iron and consumed about 871 MMT the same year. Apart from China, India, Russia, and Japan were the leading producers. In light of trade disruptions from Ukraine and Russia, Brazil, Canada, and India are estimated to supply more pig iron to the U.S. market. Furthermore, in July 2022, Stelco Holdings Inc., a Canada-based integrated steel producer reported that its one million metric tons were available for use in the U.S. market.
U.S. approximate decline in imports and unit values of pig iron from Russia, 2022 (Q1 & Q2)
|
Month |
Imports (Thousand metric tons) |
Unit value (Dollars per metric ton) |
|
January |
220 |
550 |
|
February |
200 |
550 |
|
March |
150 |
550 |
|
April |
0 |
0 |
|
May |
30 |
420 |
|
June |
0 |
0 |
- Demand from the automotive sector: In the third week of January 2025, the U.S. raw steel production reached 1,644,000 net tons and the capacity utilization was 73.8%. In 2023, of the total raw steel produced, the automotive sector accounted for 14%, preceded by construction (24%) and followed by converting end uses (8%), non-classified shipments (4%), machinery (3%), appliances (3%), and others (12%), states USGS. The growth in the automotive sector and its component manufacturing is attributed to the introduction of the 2021 Bipartisan Infrastructure Law and the 2022 Inflation Reduction Act, thereby, propelling the demand for ferrosilicon market.
Challenges
- A gradual shift away from pig iron and scrap steel to decouple from import risks: Some steel manufacturers are keen on limiting the dependence on imports of scrap steel and limiting pig iron usage. For example, U.S. Steel announced plans to increase the annual capacity of 500,000 metric tons of pig iron at Gary, IN steel mill. This will allow its Big River Steel minimill in Osceola, Cleveland-Cliffs, AR, and Toledo, OH, to generate hot-briquetted iron, a pig iron alternative.
Ferrosilicon Market Size and Forecast:
| Report Attribute | Details |
|---|---|
|
Base Year |
2025 |
|
Forecast Period |
2026-2035 |
|
CAGR |
3.1% |
|
Base Year Market Size (2025) |
USD 11.79 billion |
|
Forecast Year Market Size (2035) |
USD 16 billion |
|
Regional Scope |
|
Ferrosilicon Market Segmentation:
Application Segment Analysis
The deoxidizer segment is projected to hold the majority of the ferrosilicon market share in 2035. This can be attributed to the rising worldwide demand for steel for various industries including as a deoxidizer in the steel subsector. Based on silicon content, ferrosilicon accounted for nearly 70% of global silicon production in 2021. With the gradual expansion of urban construction ferrosilicon offers deoxidation at a low cost According to statistics, the annual ferrosilicon used for deoxidation accounts for more than 90% of the annual ferrosilicon production. With the development of ferro silicon industry chain, its application as a raw material for deoxidation in the field of steelmaking and smelting production is experiencing a steep rise.
End user Segment Analysis
The stainless-steel segment is expected to garner a significant share. Stainless steel is less prone to dusting, corrosion, or staining after exposure to water. It is used in many household appliances as it is recyclable and easy to sterilize and use, particularly in kitchen sinks, cutlery, and cookware manufacturing, along with medical instruments such as surgical tools. According to the British Stainless Steel Association (BSSA), the global stainless steel production by Q1 2024 was 14.6 million metric tons, registering a CAGR of 5.5%.
Our in-depth analysis of the global market includes the following segments:
|
By Type |
|
|
By Application |
|
|
By End use |
|

Vishnu Nair
Head - Global Business DevelopmentCustomize this report to your requirements — connect with our consultant for personalized insights and options.
Ferrosilicon Market Regional Analysis:
North America Ferrosilicon Market Insights
The North America ferrosilicon market is projected to exhibit a staggering CAGR during the forecast timeline, with the U.S. emerging as the key regional market. With the rising demand for stainless steel across end-use industries, the adoption of ferrosilicon for stainless steel manufacturing is expected to expand in the forthcoming years. The region is dominated by the presence of some prominent steel companies comprising United States AK Steel, Nucor Corp., ArcelorMittal USA, and Steel Dynamics Inc. (STLD).
The U.S. ferrosilicon (comprising 55% silicon) export value in September 2024 was USD 315,000 and between January to September, it was estimated at USD 4,190,000, while the ferrosilicon (7202.29.0000) exports in September 2024 were worth USD 819,000 and during Jan-Sep it was USD 8,420,000. Silicon metal (99.99% silicon) exports were USD 815,000, primarily to Japan with a gross weight of 5,850 metric tons. The U.S. government is keen on minimizing the dependency on ferrosilicon imports. In June 2024, the U.S. Commerce Department imposed high duties on imports from Russia- a preliminary subsidy rate of 748.58% and a preliminary dumping rate of 283.27%.
Asia Pacific Ferrosilicon Market Insights
Asia Pacific ferrosilicon market is poised to hold the largest revenue share of 64% by 2035. The growth of the market can be attributed majorly to the presence of China and India, the two largest steel-producing countries in the world. Steel production in India rose from 100.3 million tons in 2020 to 119 million tons in 2021. The rapid modernization of the economy, increasing construction, infrastructure development, and growing manufacturing industries in the region are projected to increase the market growth during the forecast. The manufacturing sector includes automobile vehicles, consumer electronics, and construction materials. Also, the higher production capacity of China with its lower steel prices increases the demand for the export of steel from the region.
The Japan ferrosilicon market had a share of over 10% of Asia Pacific in 2024. The demand for ferrosilicon as an inoculant for iron casting despite a slump in crude steel production is factoring the country’s growth. Furthermore, the presence of prominent foundries in Japan, such as Ota Chuzosho Co., Ltd., Tomotetsu Kogyo Co., Ltd., Shimamura Industry Co., Ltd., and Koyochuzo Co., Ltd., positively influences the country’s trajectory.
Ferrosilicon Market Players:
- Elkem ASA
- Company Overview
- Business Strategy
- Key Product Offerings
- Financial Performance
- Key Performance Indicators
- Risk Analysis
- Recent Development
- Regional Presence
- SWOT Analysis
- Feng Erda Group
- DMS Powders
- Eurasian Resources Group
- Ferroglobe PLC
- Finnfjord AS
- Hindustan Alloys Private Limited
- Russian Ferro-Alloys Inc.
- Mechel PAO
- OM Holdings Ltd.
- Westbrook Resources Ltd.
The market players are capitalizing on the expansive steel production industry by strategically engaging in collaborations, mergers and acquisitions, development of new manufacturing facilities, and product launches. Furthermore, the automobile space, particularly EVs showcases promising opportunities for the companies operating in the ferrosilicon market. Some of them include:
Recent Developments
- In September 2024, the U.S. Department of Commerce announced an award of USD 123 million in direct funding to Polar Semiconductor, LLC as part of the 2022 CHIPS and Science Act. The award followed the preliminary MoU of due diligence by the U.S. Department of Commerce. Additionally, Polar announced its sale of USD 175 million in equity financing to Prysm Capital and Niobrara Capital, making it a U.S. majority owned foundry.
- In May 2024, Gerdau, a prominent steel producer disclosed its plan to expand its operations in Mexico and increase its capacity by 600,000 tons/year of special steels. This strategic expansion is expected to positively influence the local automotive sector.
- In April 2024, BENTELER Steel/Tube Manufacturing Corporation, announced a USD 21 million investment as part of an expansion in Northwest Louisiana to streamline oil and gas, energy, and engineering sector supply chains. This is expected to create 49 new jobs at the facility 96 indirect new jobs in the Northwest region of the U.S.
- In July 2021, Shyam Metssalics and Energy Limited revealed a production of 5.71 MTPA steel and ferro alloys, with a capacity utilization of 90-95%. The company’s ferrosilicon export countries include the U.S., Japan, Italy, South Korea, Nepal, and Bangladesh.
- Report ID: 4613
- Published Date: Sep 10, 2025
- Report Format: PDF, PPT
- Explore a preview of key market trends and insights
- Review sample data tables and segment breakdowns
- Experience the quality of our visual data representations
- Evaluate our report structure and research methodology
- Get a glimpse of competitive landscape analysis
- Understand how regional forecasts are presented
- Assess the depth of company profiling and benchmarking
- Preview how actionable insights can support your strategy
Explore real data and analysis
Frequently Asked Questions (FAQ)
Ferrosilicon Market Report Scope
Free Sample includes current and historical market size, growth trends, regional charts & tables, company profiles, segment-wise forecasts, and more.
Connect with our Expert


Copyright @ 2026 Research Nester. All Rights Reserved.
