Electric Vehicle Charging Infrastructure Market Outlook:
Electric Vehicle Charging Infrastructure Market size was over USD 40.26 billion in 2025 and is projected to reach USD 457.06 billion by 2035, growing at around 27.5% CAGR during the forecast period i.e., between 2026-2035. In the year 2026, the industry size of electric vehicle charging infrastructure is evaluated at USD 50.22 billion.
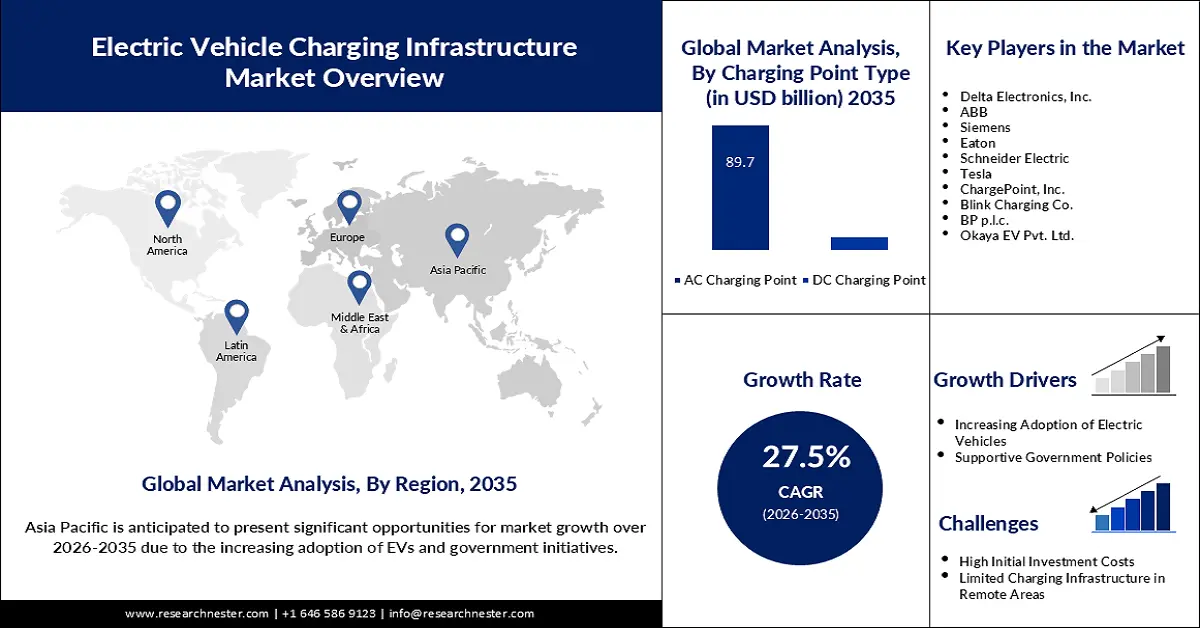
The EV charging infrastructure market is growing due to the increasing adoption of electric vehicles and supportive government policies. For instance, in January 2024, the U.S. government allocated USD 623 million in infrastructure investment toward EV charging infrastructure. This indicates a growing support to enhance the accessibility of EV charging. Additionally, regulatory frameworks and standards are being established to ensure the safety, reliability, and interoperability of the charging infrastructures. The collective efforts by governments and industry stakeholders are driving the prospects of the EV charging infrastructure market.
Businesses are investing aggressively to promote the expansion of their charging networks and product innovation to take advantage of the growth in the market. For instance, in June 2024, ChargePoint and LG Electronics partnered with integrated hardware and software-based solutions to execute EV recharge. Other firms are forming strategic partnerships to share expertise and resources toward expanding the network. The R&D investments are also testing cutting-edge technologies and charging features that answer EV owners' diverse requirements.
Key Electric Vehicle (EV) Charging Infrastructure Market Insights Summary:
Regional Highlights:
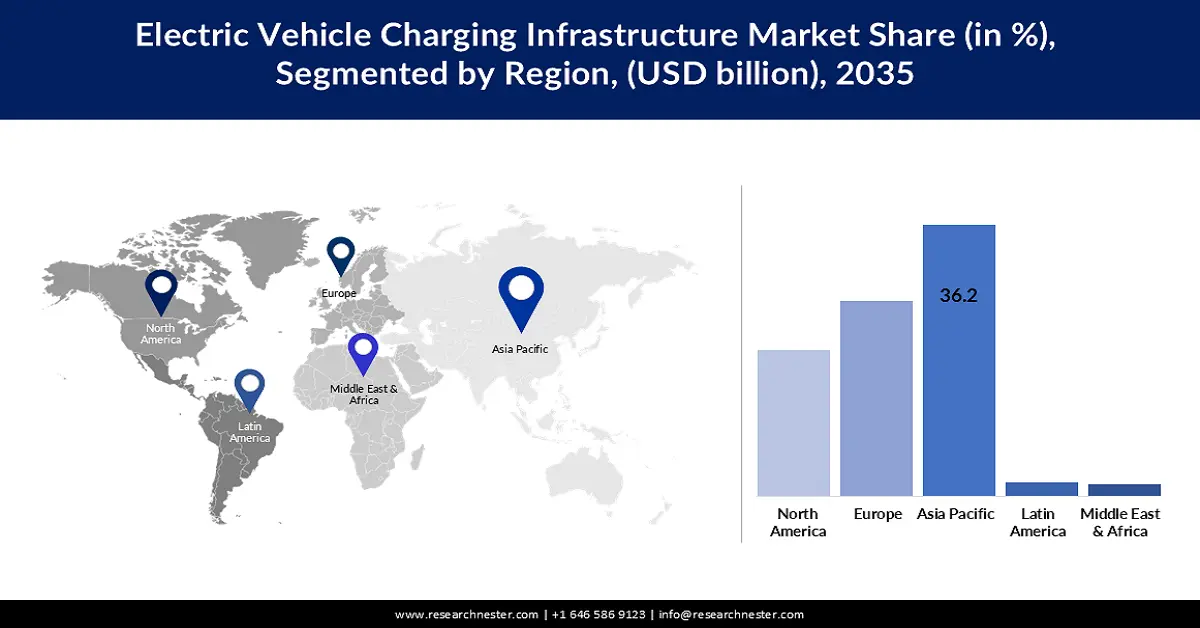
- The Asia Pacific electric vehicle (EV) charging infrastructure market will dominate around 36.20% share by 2035, driven by urbanization, rising disposable income, government policies, and presence of major automakers.
- The North America market will exhibit massive growth during the forecast timeline, driven by rising EV adoption, favorable policies, and investments in charging infrastructure.
Segment Insights:
- The ac charging point segment in the electric vehicle charging infrastructure market is anticipated to secure an 89.70% share by 2035, driven by affordability and flexibility for residential use.
- The fixed installation segment in the electric vehicle charging infrastructure market is forecasted to witness robust growth till 2035, attributed to scalability and deployment in commercial applications.
Key Growth Trends:
- Rise in sales of EVs
- Decreasing battery costs
Major Challenges:
- Charging standards
Key Players: Delta Electronics, Inc., ABB, Siemens, Eaton, Schneider Electric, Tesla, ChargePoint, Inc., Blink Charging Co., BP p.l.c., and Okaya EV Pvt. Ltd.
Global Electric Vehicle (EV) Charging Infrastructure Market Forecast and Regional Outlook:
Market Size & Growth Projections:
- 2025 Market Size: USD 40.26 billion
- 2026 Market Size: USD 50.22 billion
- Projected Market Size: USD 457.06 billion by 2035
- Growth Forecasts: 27.5% CAGR (2026-2035)
Key Regional Dynamics:
- Largest Region: Asia Pacific (36.2% Share by 2035)
- Fastest Growing Region: Asia Pacific
- Dominating Countries: China, United States, Germany, Norway, United Kingdom
- Emerging Countries: China, India, Japan, South Korea, Thailand
Last updated on : 17 September, 2025
Electric Vehicle Charging Infrastructure Market Growth Drivers and Challenges:
Growth Drivers:
-
Rise in sales of EVs: The rise in sales of electric vehicles is among the primary factors driving the growth of the electric vehicle charging infrastructure market. This spike is due to factors such as environmental awareness, government incentives, and continuous technological advancements in electric vehicles. As per the International Energy Agency, the electric vehicle industry witnessed a surge with electric car sales reaching USD 14 million in 2023. This rising number of EVs on the road is expected to boost the demand for charging infrastructure during the forecast period.
-
Decreasing battery costs: A decline in battery costs boosts EV adoption and further drives the market growth. As battery technology improves, the overall cost of EVs decreases with traditional internal combustion engine vehicles. This affordability factor, combined with the environmental benefits of EVs, is encouraging consumers to switch to these EVs. The increasing fleet of EVs will correspondingly require a robust, widespread charging network that caters to the requirements of EV owners.
Challenges
-
Insufficient grid capacity: In 2022, only about 0.6% of the U.S. electricity demand was used to charge EVs. According to a report by the International Energy Agency (IEA), by 2030, with roughly 26 million EVs on the road, electricity demand could increase by as much as 20%. By 2035, it can further increase to 40%. Unlike any quick-charging functionality, the wide-scale acceptance of an EV stresses the grid capacity in accommodating the increased demand for electricity. This demands a huge investment in the upgrading or modernization of grids to handle such challenges. As a result, this factor limits the adoption of EV charging infrastructure.
-
Charging standards: The challenge arising from non-standardized charging protocols and connectors is a major factor limiting growth. Global standardization creates a barrier for market players as different countries use different charging standards. For instance, Combined Charging System (CCS) is rapidly growing in Europe and North America, but CHAdeMO is still dominant in Japan, and China has its own GB/T standard. This fragmentation can cause confusion among consumers and added expense for manufacturers developing different types of charging equipment.
Electric Vehicle Charging Infrastructure Market Size and Forecast:
| Report Attribute | Details |
|---|---|
|
Base Year |
2025 |
|
Forecast Period |
2026-2035 |
|
CAGR |
27.5% |
|
Base Year Market Size (2025) |
USD 40.26 billion |
|
Forecast Year Market Size (2035) |
USD 457.06 billion |
|
Regional Scope |
|
Electric Vehicle Charging Infrastructure Market Segmentation:
Charging Point Type Segment Analysis
The AC charging point segment is poised to hold the largest share of 89.7% in the electric vehicle (EV) charging infrastructure market during the forecast period. The continuous demand for AC charging points can be attributed to cost and flexibility, especially for residential applications. Companies collaborate to increase their presence in the market. For example, MG Motor India collaborated with Prestige Group to set up 100 EV chargers across residential properties in Bangalore in August 2023. Such developments offer a vital push for the growth in the adoption of home charging solutions.
Installation Type Segment Analysis
By the end of 2035, fixed installation segment is estimated to capture around 78% electric vehicle charging infrastructure market share. Fixed installations are mainly deployed as they offer reliability, scalability, and seamless integration into existing infrastructures. Fixed stations provide robust and convenient charging, suitable for public charging networks and commercial applications. For instance, in July 2023, Siemens equipped 64 ENGIE Vianeo stations with 320 high-power EV chargers, along freeway rest areas across France, thereby showing the scalability and efficiency of fixed infrastructure in high-traffic places even further.
Application Segment Analysis
In electric vehicle charging infrastructure market, private segment is expected to account for around 73.5% revenue share by 2035. The factors driving the growth include easy installation and minimal infrastructure updates, which the public charging stations do not offer and minima. Partnerships among other market players are further supporting the segment's growth. For instance, in June 2024, Blink Charging Co. and Envoy Technologies Inc. collaborated to deliver shared EVs on-site among the residents. This move boosts the convenience and sustainability among the residents, consequently increasing the demand for private charging solutions.
Our in-depth analysis of the electric vehicle (EV) charging infrastructure market includes the following segments
|
Segment |
Subsegments |
|
Charging Level |
|
|
Charging Point Type |
|
|
Installation Type |
|
|
Application |
|
|
Charging Infrastructure Component |
|

Vishnu Nair
Head - Global Business DevelopmentCustomize this report to your requirements — connect with our consultant for personalized insights and options.
Electric Vehicle Charging Infrastructure Market Regional Analysis:
APAC Market Insights
Asia Pacific industry is expected to hold largest revenue share of 36.2% by 2035. Several key factors are driving this growth, including rapid urbanization, increasing disposable income, and supportive government policies promoting EV adoption. Additionally, the presence of major automotive manufacturers in the region, coupled with their focus on developing affordable EV models contributes to the market's growth in this region.
China leads the APAC EV charging infrastructure market and is expected to continue its dominance until 2035. The prime factors driving EV charging infrastructure in China include government support through subsidies, incentives, and benign policies for spreading EV adoption and developing a robust charging network. For instance, in June 2023, the Chinese government extended the exemption on new energy vehicle taxes to 2027, continuing to drive EV sales and indirectly charging infrastructure demand.
India’s EV charging infrastructure industry is expected to rise at an exponential CAGR during the forecast period. One of the huge catalysts for growth in India's EV charging infrastructure market has been the ambitious target set by the government, which is to achieve 30% EV sales penetration by the year 2030. Initiatives launched by the government to achieve this target include the Faster Adoption and Manufacturing of Hybrid and Electric Vehicles scheme, which provides financial incentives for both purchases of EVs and the setting up of charging infrastructure. Further, partnerships between public and private sectors have been quite instrumental in expanding the network of charging outlets and thereby accelerating the adoption of EVs in India.
North America Market Insights
North American EV charging infrastructure market is likely to expand at a massive growth rate during the projection period. Some factors driving growth include the rising adoption of EVs, favorable government policies such as tax incentives and subsidies, and technological advancements in EV charging. Furthermore, increasing funds by the public and private sectors for the development of charging infrastructure is expected to boost market growth going ahead.
The U.S. is anticipated to lead the EV charging infrastructure market with lucrative growth through 2035. One major development that reinforces growth is the Bipartisan Infrastructure Law passed in November 2021, which dedicated USD 7.5 billion to establishing a national network of 500,000 EV chargers. This investment is likely to substantially improve access to and availability of the charging infrastructure, thereby further stimulating EV adoption and market growth.
Canada is likely to offer ample expansion opportunities for players in the EV charging infrastructure market during the forecast period. In February 2022, the Canadian government announced an investment of USD 547.5 million to facilitate the installation of 50,000 EV chargers across the country. This resulted in added convenience to charging electric vehicles while supporting the expansion of the market.
Electric Vehicle Charging Infrastructure Market Players:
- Delta Electronics, Inc.
- Company Overview
- Business Strategy
- Key Product Offerings
- Financial Performance
- Key Performance Indicators
- Risk Analysis
- Recent Development
- Regional Presence
- SWOT Analysis
- ABB
- Siemens
- Eaton
- Schneider Electric
- Tesla
- ChargePoint, Inc.
- Blink Charging Co.
- BP p.l.c.
- Okaya EV Pvt. Ltd.
The EV charging infrastructure market is highly fragmented, with established players competing for market share against new entrants. ChargePoint, Inc., Blink Charging Co., and Tesla, Inc. presently dominate the market, driven by strong brand presence, strength in technology, and the wide spread of their charging networks. Companies like these have a strong focus on building scale through strategic partnerships, business acquisitions, and innovation in the sphere of EV charging.
Some partnerships and collaborations are changing the competitive landscape. For example, in October 2023, Toyota and its luxury brand Lexus joined Tesla's North American Charging Standard plug for EV charging. This decision is in line with similar steps by other large automakers, including Ford, GM, Honda, and BMW. This collaboration is likely to further raise the competitive bar in driving innovation within the market.
Here are some leading companies in the electric vehicle (EV) charging infrastructure market :
Recent Developments
- In April 2024, CHARGE ZONE, one of India's foremost EV charging sector designers, gained considerable financial support through a USD 19 million investment by British International Investment (BII), the UK's development finance organization.
- In March 2024, V-Green announced the plans to invest around 10 trillion dongs (USD 404 million) in the next two years to construct EV charging stations across the country.
- In January 2022, Brazil's motor maker, WEG SA, partnered with Neoenergia SA, a power company, to deliver charging stations for electric vehicles.
- Report ID: 6324
- Published Date: Sep 17, 2025
- Report Format: PDF, PPT
- Explore a preview of key market trends and insights
- Review sample data tables and segment breakdowns
- Experience the quality of our visual data representations
- Evaluate our report structure and research methodology
- Get a glimpse of competitive landscape analysis
- Understand how regional forecasts are presented
- Assess the depth of company profiling and benchmarking
- Preview how actionable insights can support your strategy
Explore real data and analysis
Frequently Asked Questions (FAQ)
Electric Vehicle (EV) Charging Infrastructure Market Report Scope
Free Sample includes current and historical market size, growth trends, regional charts & tables, company profiles, segment-wise forecasts, and more.
Connect with our Expert


Copyright @ 2026 Research Nester. All Rights Reserved.
