Surfactants Market Outlook:
Surfactants Market size was valued at USD 51.18 billion in 2025 and is projected to reach USD 82.65 billion by the end of 2035, registering over 5.1% CAGR during the forecast period i.e., between 2026-2035. In 2026, the industry size of surfactants is evaluated at USD 53.69 billion.
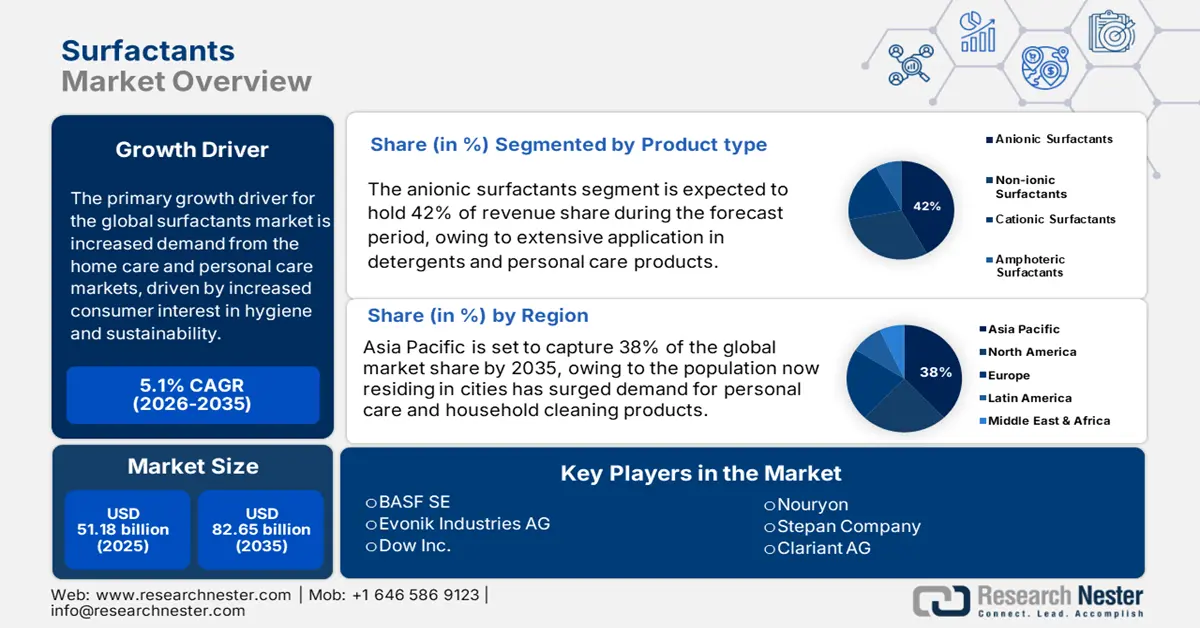
The primary growth driver in the global surfactants market is increased demand from the home care and personal care markets, driven by increased consumer interest in hygiene and sustainability. Moreover, the U.S. Department of Agriculture (USDA) reports a consistent increase in the use of agricultural surfactants that is attributed to high use of green formulations for crop protection, projected to increase annually. This increase in demand has a direct effect on market growth by promoting more efficient and environmentally friendly use of surfactants.
The supply chain for the surfactant raw materials from mainly renewable and petrochemical feedstocks has been thoroughly overhauled to satisfy the needs of world demand and sustainability. Cleaning solutions with antimicrobial properties are essential for society, the economy, and public health. Their significance and applicability have grown in recent years. In the United States, 1.7 million hospital-acquired infections (HAI) are reported each year, leading to 99,000 fatalities and an additional $20 billion in costs for the national health care system. Import-export balances show an emphasis on raw materials imported from Asia, mainly palm oil derivatives from Indonesia and Malaysia, utilized for bio-based surfactants. Indonesia produces more than 30 million tons of palm oil every year, providing 4.5% of its GDP and providing employment to 3 million people.
Key Surfactants Market Insights Summary:
Regional Insights:
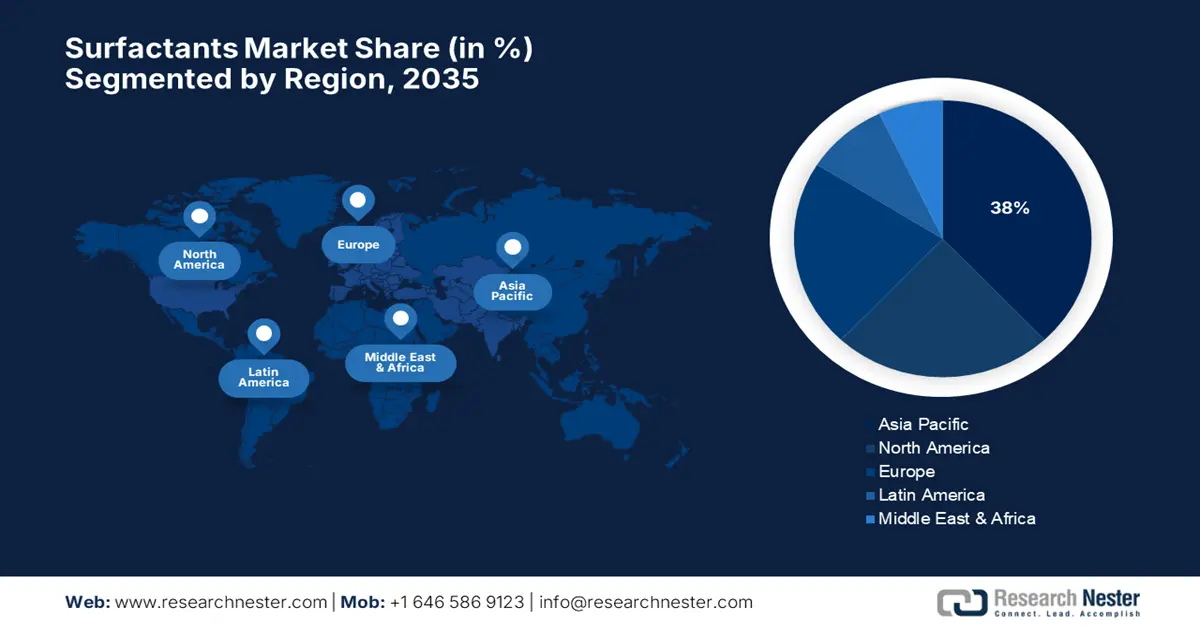
- The Asia Pacific surfactants market is anticipated to capture about 38% of global revenue by 2035, advancing at a 5.7% CAGR during 2026–2035, impelled by rapid urbanization and regulatory initiatives promoting biodegradable surfactants.
- North America is projected to hold approximately 24% of the global share by 2035, progressing at around 4.3% CAGR during 2026–2035, owing to the EPA Safer Choice label encouraging environmentally friendly surfactant production.
Segment Insights:
- The anionic surfactants segment in the Surfactants Market is projected to command a 42% share by 2035, propelled by their extensive application in detergents and personal care formulations.
- The household cleaning segment is expected to secure a 38% share by 2035, supported by rapid urbanization and the growing preference for green surfactants in home care products.
Key Growth Trends:
- Rising regulatory compliance and sustainability standards
- Technological innovations and sustainability initiatives
Major Challenges:
- Regulatory compliance and environmental restrictions
- Raw material supply chain volatility
Key Players: BASF SE, Evonik Industries AG, Dow Inc., Nouryon, Stepan Company, Clariant AG, Croda International Plc, Solvay S.A., Indorama Ventures, Galaxy Surfactants Ltd., Arkema Group, Huntsman Corporation, Ashland Global Holdings Inc., Kao Corporation, Lion Corporation.
Global Surfactants Market Forecast and Regional Outlook:
Market Size & Growth Projections:
- 2025 Market Size: USD 51.18 billion
- 2026 Market Size: USD 53.69 billion
- Projected Market Size: USD 82.65 billion by 2035
- Growth Forecasts: 5.1% CAGR (2026-2035)
Key Regional Dynamics:
- Largest Region: Asia Pacific (38% Share by 2035)
- Fastest Growing Region: Asia Pacific
- Dominating Countries: United States, Germany, China, Japan, United Kingdom
- Emerging Countries: India, South Korea, Brazil, Australia, Mexico
Last updated on : 26 September, 2025
Surfactants Market - Growth Drivers and Challenges
Growth drivers
- Rising regulatory compliance and sustainability standards: Emerging new regulations by organizations such as the U.S. Environmental Protection Agency (EPA) and the European Chemicals Agency (ECHA) are putting more compliance requirements on surfactant makers, particularly on home and personal care companies. For example, EPA's newly enacted Toxic Substances Control Act (TSCA) rules are projected to increase compliance expenses, leading manufacturers to shift more toward safe, biodegradable surfactant materials. This drive stimulates the market for green products and promotes innovations in cleaner ingredient sourcing to market growth, through pushing more sustainable, regulatory-compliant solutions.
- Technological innovations and sustainability initiatives: Technological innovations, such as the application of advanced catalyst processes in the production of surfactants, have increased efficiency, allowing for cost savings of an economic nature along with environmental advantages. Efforts towards sustainability, such as the utilization of renewable raw materials and carbon dioxide reduction, are revolutionizing the industry's landscape. Industry performers and downstream applications, such as personal care and agriculture, are being affected by these trends and are expected to invest further in green-friendly products, driving long-term market growth.
- Rising demand in agriculture and food processing: In agriculture, natural surfactants serve as adjuvants in pesticides, herbicides, and foliar sprays to enhance solubility and ensure efficacy while reducing chemical residues. U.S. vegetable oil imports were above $8.0 billion until they crossed $10.9 billion in 2022. Much of the growth in demand in 2022 was due to increased use of biodiesel and renewable diesel, both of which are transportation fuels produced from agricultural feedstocks, including vegetable oils. Production of biofuels increased to 3.1 billion gallons in 2022. In this context, increasing government programs favoring sustainable agriculture and food safety enable further adoption of natural surfactants in these sectors and good secular growth opportunities.
1. Emerging Top Palm Oil Producing Countries
Palm Oil Production 2024-2025
|
Country |
% of Global Production |
Total Production (Metric Tons) |
|
Indonesia |
58% |
46,000,000 |
|
Malaysia |
25% |
19,400,000 |
|
Thailand |
4% |
3,330,000 |
|
Colombia |
2% |
1,900,000 |
|
Nigeria |
2% |
1,500,000 |
|
Guatemala |
1% |
990,000 |
|
Papua New Guinea |
1% |
830,000 |
|
Brazil |
0.76% |
600,000 |
|
Côte d'Ivoire |
0.76% |
600,000 |
|
Honduras |
0.75% |
595,000 |
Source: USDA
2. Trade Data of Anionic Surface-Active Agents
Anionic surface-active agents trade in 2023
|
Leading Exporters |
Value (USD Million) |
Leading Importers |
Value (USD Million) |
|
China |
607 |
France |
258 |
|
Germany |
571 |
United States |
227 |
|
United States |
342 |
China |
171 |
Source: OEC
Challenges
- Regulatory compliance and environmental restrictions: With increasingly stringent regulations surrounding water pollution and biodegradability, surfactant producers face significant compliance burdens. These regulatory frameworks require costly reformulations and extensive testing, diverting resources away from new product development and adding to operational overheads. In the personal and home care sectors, adapting existing surfactants to meet enhanced wastewater discharge standards extends time-to-market and compresses margins. Such regulatory pressure adversely impacts market agility and innovation, as manufacturers are compelled to prioritize compliance and cost-efficiency over sustainability and differentiation, ultimately slowing the overall pace of growth across the surfactant value chain.
- Raw material supply chain volatility: The surfactants industry relies heavily on raw materials imported internationally, such as crop derivatives and special chemicals. Supply chain interference through geopolitical tensions, volatility over crop output due to climate uncertainty, and traffic congestion has caused irregular availability and steep price volatility. These instabilities raise the manufacturing cost and make inventory planning difficult for household and personal cleaning product makers. Uncertainty hinders long-term planning, postpones product launching, and betrays competitiveness, a substantial barrier to uniform market expansion.
Surfactants Market Size and Forecast:
| Report Attribute | Details |
|---|---|
|
Base Year |
2025 |
|
Forecast Year |
2026-2035 |
|
CAGR |
5.1% |
|
Base Year Market Size (2025) |
USD 51.18 billion |
|
Forecast Year Market Size (2035) |
USD 82.65 billion |
|
Regional Scope |
|
Surfactants Market Segmentation:
Product Type Segment Analysis
Anionic surfactants lead the product type segment, projected to hold a 42% market share by 2035, fueled by their widespread use in detergents and personal care products. Biobased products increased the worth of the U.S. economy from $464 billion in 2020 to $489 billion in 2021. This represents a 5.1% increase, or $25 billion, over 2020. Regulatory standards by such bodies as the EPA that promote biodegradation and low aquatic toxicity are beneficial to demand. Increased consumer demand for green and mild products also benefits from using the most preferred product by the global manufacturer as an anionic surfactant.
Application Segment Analysis
Surfactants for household cleaning are expected to account for the largest market share of 38% by 2035. The growth driver is increasing urbanization, according to UN statistics. By 2050, it is anticipated that 68% of the world's population will reside in urban regions, up from 55% currently, which translates to strong demand for sanitary products. The EPA Safer Choice program has hastened the usage of green surfactants in home cleaners even more quickly. Through stringent management of chemical safety, growth in North America and Europe becomes possible, and growth economies are driven by growing disposable income and store chain penetration with organized premium cleaners.
End Use Segment Analysis
Personal care surfactants dominate the end-use industry segment with an estimated 35% revenue market share in 2035. This direction shows that the consumption of haircare and skincare products in the global market is estimated to grow. Customer demand for sulfate-free and biodegradable surfactants is driving formulation development. Consumer protection legislation of developed nations and environmental certification schemes also spur producers to invest more dollars in environmentally preferable surfactant technology, boosting differentiation and penetration.
Our in-depth analysis of the global surfactants market includes the following segments:
|
Segments |
Subsegments |
|
Product Type |
|
|
Application |
|
|
End Use |
|

Vishnu Nair
Head - Global Business DevelopmentCustomize this report to your requirements — connect with our consultant for personalized insights and options.
Surfactants Market - Regional Analysis
Asia Pacific Market Insights
Asia Pacific surfactants market is expected to share about 38% of global revenue by 2035, with a 5.7% CAGR growth rate during 2026-2035. Rapid urbanization, with over 55% of the population now living in urban areas, has driven increased demand for household and personal care cleaning products. Regional governments are implementing rules for biodegradable surfactants, which are decreasing waterway pollutants in Australia and South Korea through pilot recycling programs.
The surfactants market in China is experiencing robust growth, driven by its massive manufacturing sector and rising domestic consumption in cleaning and personal care products. This expansion is further accelerated by stringent environmental regulations pushing the industry towards innovative, bio-based, and biodegradable alternatives. While competition is intense and raw material prices are volatile, the market is strategically shifting from basic commodities to high-value, specialty surfactants, solidifying China's role as a critical and evolving global player.
Source: OEC
By the year 2035, Indonesia's capacity to produce biodiesel and oleochemicals has expanded significantly over the last ten years. By 2025, the nation's current capacity of 19.7 billion liters for biodiesel production is anticipated to grow by 1.5 billion liters. To fulfill Indonesia's next blending mandate objective of B50, the country will need an extra 4 billion liters of production capacity, according to the Indonesian Biodiesel Producers Association. It is anticipated that several new oleochemical factories with a combined capacity of 900,000 MT will be put online this year in East Java, North Sumatra, and Batam.
Indonesia Palm Oil Exports Levy and Tax Tariff
|
Products |
Levy Tariff (%) |
Tax Tariff ($/MT) |
|
Crude Palm Oil (CPO) |
7.5 |
0 – 288 |
|
Crude palm olein, crude palm stearin |
6 |
0-170 |
|
RBD (Refined, Bleached, and Deodorized) palm oil, RBD palm olein, RBD palm stearin |
4.5 |
0-192 |
|
RBD palm olein in a package of 25 kg |
3 |
0-105 |
Source: USDA
North America Market Insights
North America's market for surfactants is expected to have around 24% global demand by 2035, and is expected to have a growth rate of around 4.3% CAGR from 2026 to 2035. More stringent consumer needs for safer home and personal care chemicals are facilitated by the EPA Safer Choice label, allowing more than 50 new environmentally friendly surfactant processes in 2023 and decreasing hazardous waste levels. The spatial distribution of concentrated products is also enhancing raw material efficiency.
The market for surfactants in the U.S. is anticipated to expand as a result of increased customer demand for natural ingredients in household and personal care products and more stringent laws supporting biodegradable surfactants. As a result of the 2022 increase in biofuel output to 3.1 billion gallons, there is now a greater need for vegetable oil. Food imports make up the majority of the United States' imports, including olive oil ($1.7 billion, 78% from the EU), palm ($2.2 billion, 82% from Indonesia), and canola ($3.6 billion, 96% from Canada).
Canada is expected to hold 4.9% of the surfactants market in 2035. Nearly $1.8 billion is being invested by the Canadian government to help the biofuels sector expand. With the extension of the CFF, which was announced in Budget 2024, and the $776.3 million allocated for clean fuels projects between 2024–2025 and 2029–2030, NRCan is fulfilling its commitment. Other regulatory measures under the Chemicals Management Plan and Safer Products Act also continue to focus on sustainable formulation and reducing environmental harm. New Environmental Impact labeling and ingredient disclosure regulations introduced by Health Canada are influencing buying behavior, especially in institutional cleaning. Support also covers university-driven R&D consortia for biodegradable surfactant research and development innovation. Manufacturers are responding by increasing production for plant surfactant production, especially in Ontario and Quebec, to reduce imports.
Europe Market Insights
Europe is forecasted to hold 22% of the surfactants market by 2035, expanding with a CAGR of 3.9% between 2026 and 2035. On account of the Green Deal implemented in the EU and stringent REACH regulations in the personal care and household cleaning sectors, biodegradable and low-toxicity surfactants experienced strong growth. This growth is primarily fueled by rigorous environmental regulations, the emphasis on sustainability outlined in the European Green Deal, and a rising demand for bio-based chemicals in sectors such as cosmetics, personal care, and industrial applications. Additionally, investments in green technologies and initiatives aimed at promoting a circular economy are further propelling market growth. Additionally, national-level subsidies in Germany, France, and the Nordic countries are fostering the fast adoption and innovation of sustainable surfactants.
Crude Palm Oil Exports in 2023
|
Region / Country |
Export Value (USD thousands) |
Quantity (Kg) |
|
United Kingdom |
1,248.79 |
847,393 |
|
Germany |
2,455.80 |
858,647 |
|
France |
1,136.55 |
957,108 |
|
Italy |
4,764.71 |
2,211,420 |
|
Spain |
7,455.03 |
4,267,360 |
Source: WITS
Key Surfactants Market Players:
- BASF SE
- Company Overview
- Business Strategy
- Key Product Offerings
- Financial Performance
- Key Performance Indicators
- Risk Analysis
- Recent Development
- Regional Presence
- SWOT Analysis
- Evonik Industries AG
- Dow Inc.
- Nouryon
- Stepan Company
- Clariant AG
- Croda International Plc
- Solvay S.A.
- Indorama Ventures
- Galaxy Surfactants Ltd.
- Arkema Group
- Huntsman Corporation
- Ashland Global Holdings Inc.
- Kao Corporation
- Lion Corporation
The global surfactants market is moderately consolidated, with leading players focusing on sustainability and innovation. BASF, Evonik, and Dow hold dominant positions, investing heavily in green surfactant R&D and bio-based production. BASF alone has allocated over €2.3 billion toward sustainable manufacturing upgrades since 2018. Companies like Nouryon and Stepan focus on strategic collaborations with end-use industries to develop phosphate-free and low-foam surfactants. Indian manufacturer Galaxy Surfactants is expanding globally through patent-driven formulations, while Japan’s Kao and Lion Corporation are intensifying R&D in biodegradable ingredients for personal care, aligning with strong domestic and international demand for eco-certified formulations.
Top Global Surfactant Manufacturers
Recent Developments
- On May 2, 2025, Croda International Plc revealed a $100 million investment to expand its U.S.-based production facility for bio-based surfactants in New Castle, Delaware. The project, supported by the U.S. Department of Energy’s BioPreferred Program, is expected to increase annual output by 30%. This expansion responds to rising global demand for naturally derived surfactants in the food, agriculture, and personal care sectors, particularly across North America and Europe.
- On January 27, 2025, Pilot Chemical Company announced the commercial launch of Bio IOS, a biodegradable surfactant developed in collaboration with Japan’s Kao Corporation. Targeted at the U.S. home and personal care market, the product is expected to be manufactured in Cincinnati, Ohio. The surfactant is plant-based and meets new biodegradability benchmarks, supporting demand for clean-label cleaning products and expanding Kao’s sustainable surfactant portfolio internationally.
- Report ID: 8132
- Published Date: Sep 26, 2025
- Report Format: PDF, PPT
- Explore a preview of key market trends and insights
- Review sample data tables and segment breakdowns
- Experience the quality of our visual data representations
- Evaluate our report structure and research methodology
- Get a glimpse of competitive landscape analysis
- Understand how regional forecasts are presented
- Assess the depth of company profiling and benchmarking
- Preview how actionable insights can support your strategy
Explore real data and analysis
Frequently Asked Questions (FAQ)
Surfactants Market Report Scope
Free Sample includes current and historical market size, growth trends, regional charts & tables, company profiles, segment-wise forecasts, and more.
Connect with our Expert


Copyright @ 2026 Research Nester. All Rights Reserved.
