Soy Chemicals Market - Regional Analysis
Asia Pacific Market Insights
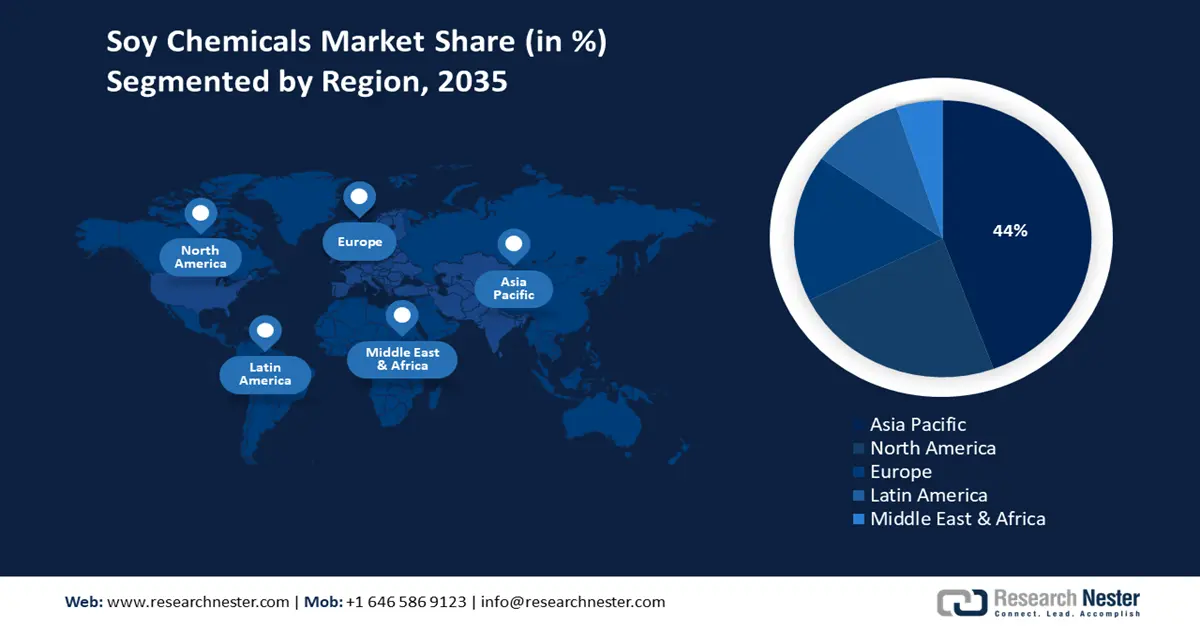
The soy chemicals market in the Asia Pacific is anticipated to account for 44% of the global revenue share by the year 2035. This growth is fueled by swift industrialization, governmental backing for green chemical initiatives, and the expansion of end-use sectors such as packaging and automotive. Japan, China, India, Malaysia, and South Korea are at the forefront of government investments in sustainable chemistry. The United States Department of Agriculture (USDA) estimated that global soybean production was 391.17 million metric tons in the years 2022/2023. Approximately 7% of soy is used for direct human food products such as tofu, soymilk, edamame beans, and tempeh. From the available data, during the season of 2022/2023, approximately 27 million metric tons of soybeans were processed into soy products, amounting to more than 32 million metric tons of wet okara. Due to the moisture content of okara, most of it is then disposed of in landfills.
China is anticipated to hold the largest share of soy chemicals revenue in Asia-Pacific by 2035, propelled by assertive industrial policies, widespread implementation of green technologies, and a vast chemical manufacturing infrastructure. The National Development and Reform Commission's emphasis on sustainable chemical production has hastened market expansion, strengthened by an increasing number of environmentally friendly chemical facilities and government investments each year.
Further, soybean trade in India is shaped by strong domestic production estimated at over 126 lakh tons in 2024, yet the country still imports large volumes of soybean oil to meet demand. India exports significant quantities of soybean meal. Despite having a cost advantage, domestic crushers often bypass local soybeans, leading to rising imports. This trade dynamic highlights both the potential and challenges in achieving self-sufficiency in India’s oilseed sector.
India’s Soybeans Trade - Exports and Imports (2023)
|
Exporting Country |
Value (USD Million) |
Importing Country |
Value (USD Million) |
|
Canada |
10.7 |
Togo |
213 |
|
Nepal |
3.12 |
Nigeria |
126 |
|
Sri Lanka |
2.61 |
Niger |
108 |
|
Belgium |
0.445 |
Mozambique |
38.5 |
|
Vietnam |
0.444 |
Tanzania |
33.4 |
Source: OEC
North America Market Insights
In 2035, North America is expected to represent 23% of the global soy chemicals market, driven by a strong demand for bio-based polymers and sustainable chemical products. The rising demand is due to government subsidies, environmental concerns, and increasing industrial innovation. Furthermore, an increase in investment in the manufacture of clean energy chemicals and the adoption of green manufacturing processes will energize the growth of the market. Demands in the market are also increasing with the global switch over to renewable raw materials and stringent safety requirements enforced in various industries.
In 2024, the U.S exported $24.6 billion worth of soybeans, making it the country’s 15th most exported product out of 1,227. The fastest-growing export markets between 2023 and 2024 were Egypt (+$534M), Turkey (+$299M), and Portugal (+$163M). On the import side, the U.S. brought in $380 million of soybeans, ranking 591st among imports. Import growth was strongest from Canada (+$76.9M), Mexico (+$4.51M), and Uruguay (+$3.19M), reflecting both shifting trade dynamics and diverse supply chain dependencies.
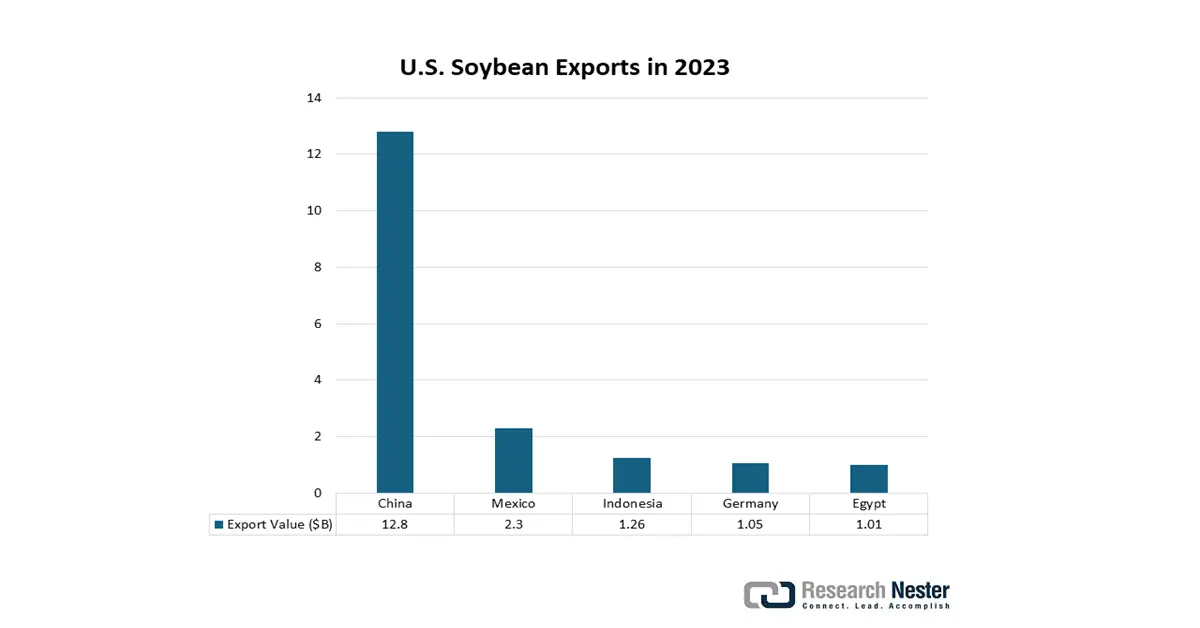
Source: OEC
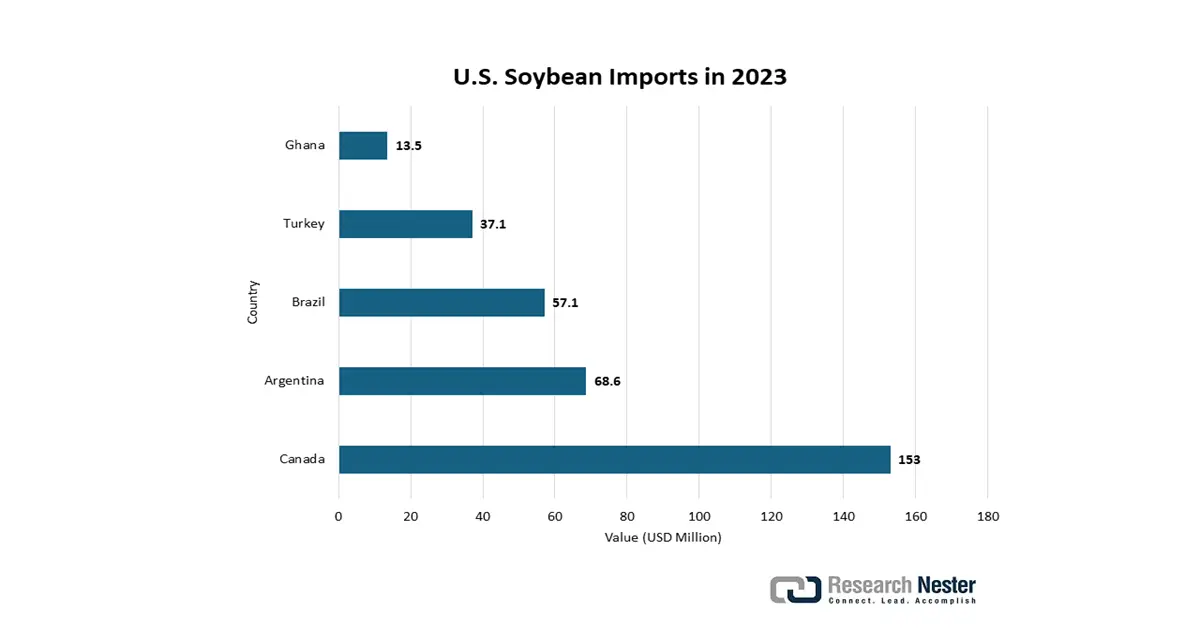
Source: OEC
Europe Market Insights
The soy chemicals market in Europe is anticipated to account for 17% of the global revenue share by the year 2035, owing to demand for natural, bio-based raw materials in food, cosmetics, and pharmaceuticals. Regulatory mechanisms such as the EU Green Deal, which targets sustainability, encourage the adoption of sustainable chemicals, which influences the industry. The rise in popularity of natural ingredients with consumers, available advancements in soy oil derivative materials, and investment into green industrial applications for various end-use sectors further facilitate growth in the market.
Crude Soya Bean Oil Export in 2023
|
Country |
Export Value (Thousand USD) |
Quantity (Kg) |
|
United Kingdom |
24,125.14 |
22,178,700 |
|
Germany |
70,056.03 |
67,959,600 |
|
France |
55,561.64 |
54,563,400 |
|
Italy |
216,718.99 |
205,785,000 |
|
Spain |
366,354.89 |
315,129,000 |
Source: WITS