Slip Additives Market - Regional Analysis
Asia Pacific Market Insights
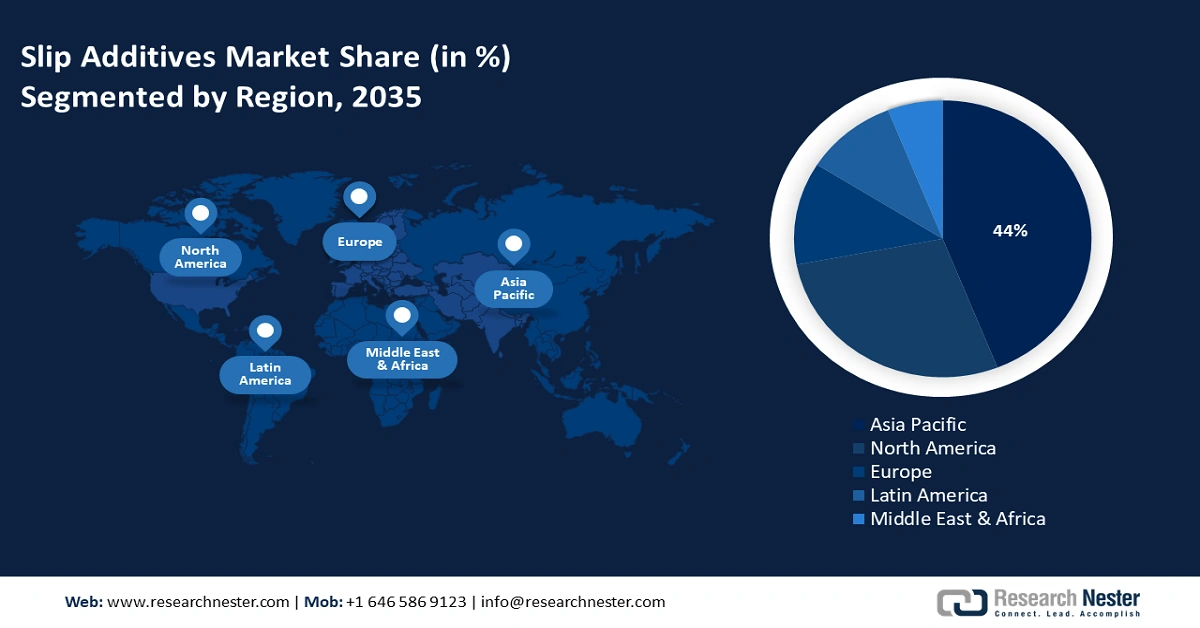
The slip additives market in the Asia Pacific is projected to capture 44% of the global market share by the year 2035. This growth is primarily attributed to swift industrialization, the growing automotive and electronics industries, as well as rigorous environmental regulations. Governments in Japan, China, and South Korea are making significant investments in sustainable chemical technologies, which in turn strengthens market expansion. The rising demand for high-performance materials and eco-friendly chemicals is driving innovation in this sector. Additionally, the increasing urbanization in India and Malaysia is further propelling the adoption of Slip Additives within the manufacturing and packaging industries.
China is projected to lead the APAC slip additives market, and this growth is fueled by substantial government investments in sustainable chemical technologies and enhancements in manufacturing processes. Initiatives spearheaded by the Ministry of Ecology and Environment, along with the NDRC, promote the adoption of green chemistry in many companies, thereby increasing demand. Furthermore, China's focus on minimizing environmental impact in the petrochemical and specialty chemical sectors, combined with robust infrastructure development, facilitates ongoing growth.
Exports of Other Polymers of Propylene or Other Olefins by Key Asia-Pacific Countries (2023)
|
Country / Region |
Export Value (in thousands USD) |
Quantity (kg) |
|
Japan |
210,327.89 |
39,958,600 |
|
China |
87,628.70 |
29,133,400 |
|
India |
11,016.10 |
12,950,900 |
|
Indonesia |
2,595.21 |
4,192,760 |
|
Malaysia |
83,202.11 |
38,631,600 |
|
Australia |
1,007.16 |
274,485 |
|
South Korea (Rep.) |
275,629.37 |
146,378,000 |
|
Other Asia, nes |
54,304.33 |
26,054,400 |
Source: WITS
North America Market Insights
In the year 2035, North America, comprising the U.S. and Canada, is projected to represent around 28% of the worldwide slip additives market. This expansion is mainly driven by strong demand from the automotive and packaging sectors for lightweight and recyclable materials. Furthermore, the regulatory demands set forth by the EPA, along with investments in sustainable chemistry supported by the U.S. Department of Energy, are promoting the adoption of green slip additives. Furthermore, federal initiatives aimed at enhancing chemical safety and innovation are contributing to market expansion, with government funding on the rise to support the production of clean energy chemicals.
The U.S. slip additives market is growing due to demand in packaging, coatings, and plastics. Fatty amides and waxes/polysiloxanes are the leading segments. Major players include Dow Chemical, BASF, and Evonik Industries. Federal grants from the Advanced Manufacturing Office support eco-friendly slip additives and safer chemical disposal. In 2023, the top exporters of polymers of propylene and other olefins were the United States ($727M), Belgium ($444M), and Japan ($271M), while the leading importers were China ($557M), Germany ($310M), and Singapore ($221M). These polymers are classified under plastics & rubbers, specifically HS4 propylene polymers.
Europe Market Insights
The slip additives market in Europe is anticipated to secure 26% of the global market share by 2035, propelled by strict environmental regulations, a rising demand for sustainable materials, and significant investments in chemical innovation. Prominent markets, including Germany, France, and the UK, are at the forefront, strengthened by strong governmental support that emphasizes green chemistry and circular economy initiatives. The European Chemicals Agency (ECHA) and the European Chemical Industry Council (CEFIC) facilitate this expansion through their policy frameworks and financial backing.
Export Data for Expansible Polystyrene in Primary Forms (2023)
|
Country |
Export Value (USD) |
Quantity (Kg) |
|
France |
138,452,140 |
75,557,400 |
|
Italy |
55,966,020 |
29,480,800 |
|
Spain |
9,735,670 |
- |
|
Portugal |
9,875,910 |
6,228,570 |
|
Greece |
91,920,720 |
55,551,600 |
|
Poland |
102,337,090 |
50,883,700 |
|
Hungary |
38,752,670 |
22,122,600 |
|
Czech Republic |
52,391,000 |
28,976,900 |
|
Sweden |
21,947,260 |
10,820,200 |
Source: WITS