Renewable Energy Market Outlook:
Renewable Energy Market size was valued at USD 1.2 trillion in 2025 and is projected to reach USD 3.8 trillion by the end of 2035, rising at a CAGR of 12.3% during the forecast period, from 2026 to 2035. In 2026, the industry size of renewable energy is evaluated at USD 1.4 trillion.
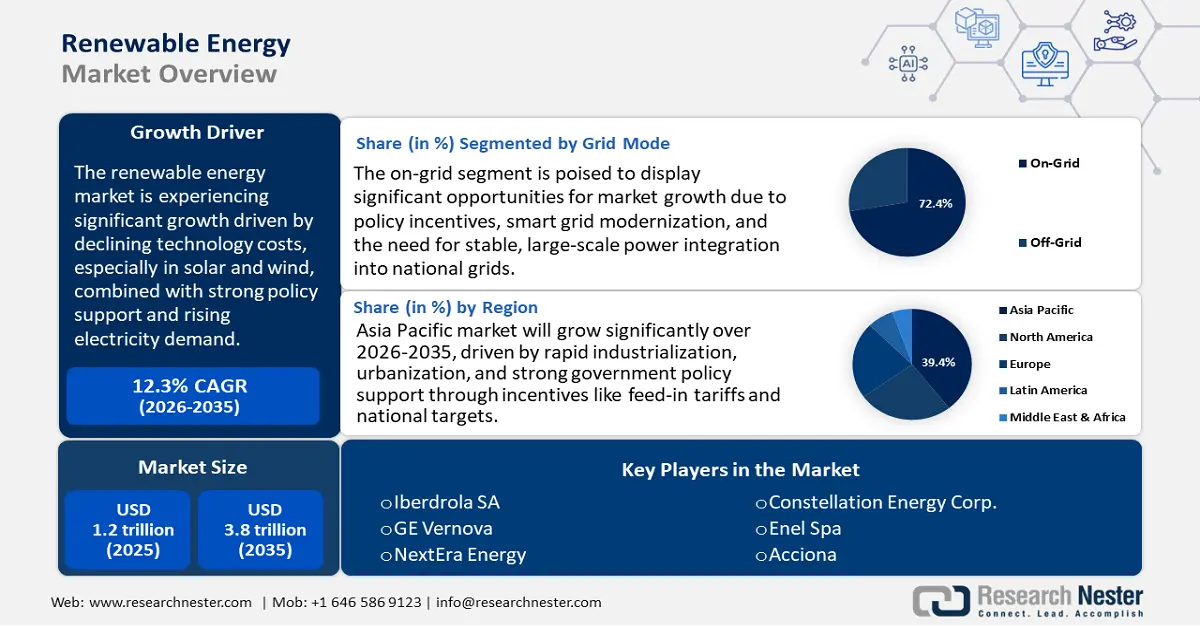
The global renewable energy market is expected to experience an upward trend over the forecast years, primarily driven by the decline in the prices of renewable energy technologies, in particular solar and wind power. The average onshore wind turbine construction cost per kilowatt (kW) in the United States increased by 1.6% in 2022 to USD 1,451, primarily due to higher costs and rises in demand by consumers of clean energy. The biggest aspects driving the market growth are capacity expansions in both solar PV and wind energy generation, and global renewable generation capacity in 2023 is projected to increase by 107 GW, owing to the declining prices and policy support. Renewables will supply 42% of electricity in the U.S. by 2050, compared with the current 20%, as economic appeal and strong incentives drive the transformation. Furthermore, increasing electricity costs and improvements in solar and wind technologies reinforce the economic viability and competitiveness in the renewable energy market, which further drives growth.
Within the renewable energy supply chain, the 2021-2024 Quadrennial Supply Chain Review released by the U.S. Department of Energy identifies about 2,500 gigawatts (GW) of new variable renewable energy capacity and 550-770 GW of new clean firm capacity as necessary to decarbonize the power system. This grand objective highlights the need to increase manufacturing and production capacities and the need to ensure a stable supply of raw materials. Moreover, the Producer Price Index of electric power generation in August 2025 was 186.902, whereas in July 2025 it was 196.902 (Index Dec 2003=100). These strong PPI numbers demonstrate increasing product values, which indicate an increase in activity and profitability across the entire renewable energy supply chain in accordance with global renewable energy market growth. There are also efforts to build more resilient domestic supply chains and minimize dependence on imports to handle global renewable energy market shocks.
Key Renewable Energy Market Insights Summary:
Regional Highlights:
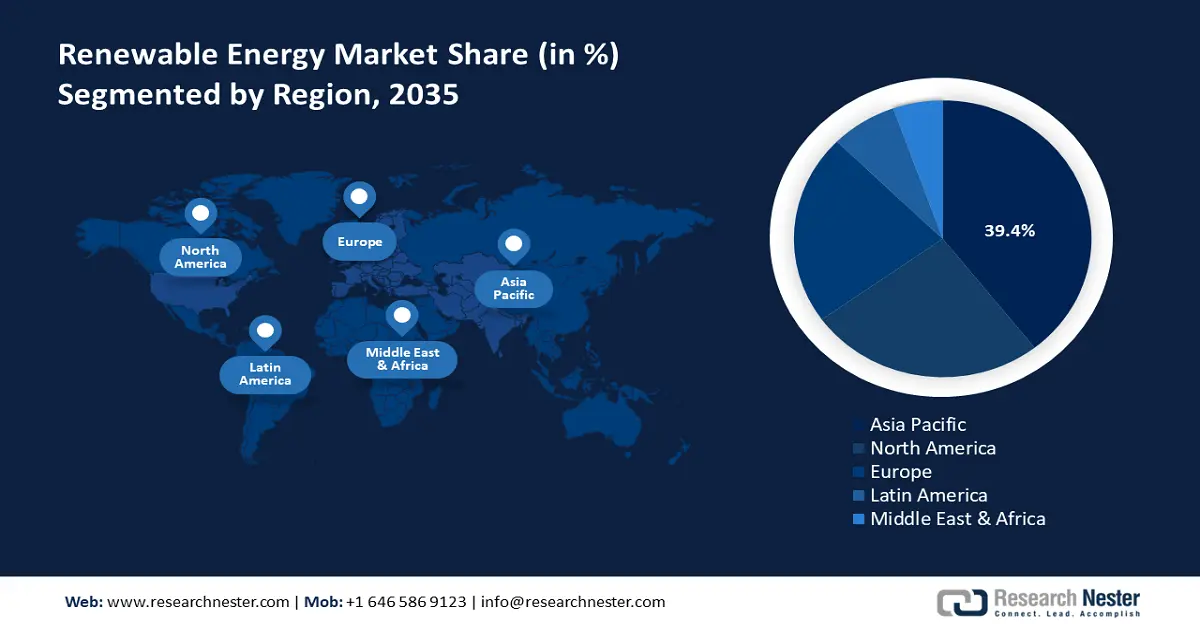
- Asia Pacific is projected to lead the renewable energy market with a 39.4% share by 2035, fueled by industrialization, policy support, and investment in solar, wind, and hydro technologies.
- North America is expected to hold a 25.7% share by 2035, driven by clean energy initiatives, solar and wind adoption, and supportive government programs.
Segment Insights:
- On-grid segment is forecasted to command a 72.4% share by 2035 in the renewable energy market, supported by grid modernization and policy stimulus.
- Greenfield deployment segment is anticipated to achieve a 64.3% share by 2035, propelled by scalability, incentives, and large-scale renewable infrastructure development.
Key Growth Trends:
- Chemical Recycling Programs
- Pressures on carbon footprint
Major Challenges:
- Expensive Environmental Compliance Costs
- Complicated Interconnection Standards
Key Players: Iberdrola SA, GE Vernova, NextEra Energy, Constellation Energy Corp., Enel Spa, Acciona, Vestas Wind Systems, Siemens Energy, Adani Green Energy, Blueleaf Energy, Tata Power, Samsung SDI, Canadian Solar Inc., Orsted, JinkoSolar
Global Renewable Energy Market Forecast and Regional Outlook:
Market Size & Growth Projections:
- 2025 Market Size: USD 1.2 trillion
- 2026 Market Size: USD 1.4 trillion
- Projected Market Size: USD3.8 trillion by 2035
- Growth Forecasts: 12.3% CAGR (2026-2035)
Key Regional Dynamics:
- Largest Region: Asia Pacific (39.4% Share by 2035)
- Fastest Growing Region: Asia Pacific
- Dominating Countries: China, United States, Germany, Japan, United Kingdom
- Emerging Countries: India, Mexico, South Korea, Brazil, Indonesia
Last updated on : 31 October, 2025
Renewable Energy Market - Growth Drivers and Challenges
Growth Drivers
- Chemical Recycling Programs: Chemical recycling technologies are becoming increasingly popular as alternatives to conventional waste management programs. These technologies permit the reduction of the complex polymers to their basic units, which means that the non-recyclable materials can also be recycled efficiently. It is projected that the implementation of chemical recycling will lessen reliance on virgin fossil resources, which matched with renewable energy targets, will boost the renewable energy market demand for renewable chemicals. In 2023, the Bioenergy Technologies Office (BETO) of the U.S. Department of Energy awarded the Catalytic Upgrading Technology Area an estimated $16 million, around 3% of the total portfolio reviewed by BETO that year. This significant funding underpins projects that will facilitate the conversion of biomass into renewable fuels and chemicals as part of the BETO mission to promote sustainable bioenergy solutions.
- Pressures on carbon footprint: The chemical industry is the largest industrial energy consumer and the third-largest industry subsector with respect to direct CO2 emissions. In 2023, global CO2 emissions in the energy sector advanced by 1.1% and reached a new record high of 37.4 billion tonnes, raising its total by 410 million tonnes. This highlights the necessity of ensuring the chemical industry embraces cleaner technologies and renewable sources of energy to reduce the effects on the environment. According to the data of the International Energy Agency (IEA), the chemical sector is one of the leading sources of global emissions, so it is necessary to pay much attention to decarbonization activities in this field.
- Recent Innovations in Catalytic Technologies: Bioenergy Technologies Office (BETO) at the U.S. Department of Energy has been actively pursuing catalytic upgrading technologies to improve the conversion of biomass and waste feedstocks into renewable fuels and chemicals. For example, the Chemical Catalysis (CAT) Program of the BETO makes available experimental and computational studies aimed at the basic chemistry of catalytic processes on the molecular and/or bond scale level of knowledge. The program includes polymerization catalysis, single-site catalysis, organocatalysis, biologically-inspired catalysis, and electrocatalysis. The CAT Program promotes fundamental research in catalytic processes of energy related to the water splitting process and fuel cells. The efforts are focused on creating high-performance and cost-effective technologies to transform biomass and waste feedstocks into energy-containing liquid transportation fuels, bioproducts, chemical intermediates, and biopower to enhance the expansion of renewable energy in the chemical sector.
Trends
Producer Price Index by Industry: Electric Power Generation: Utilities
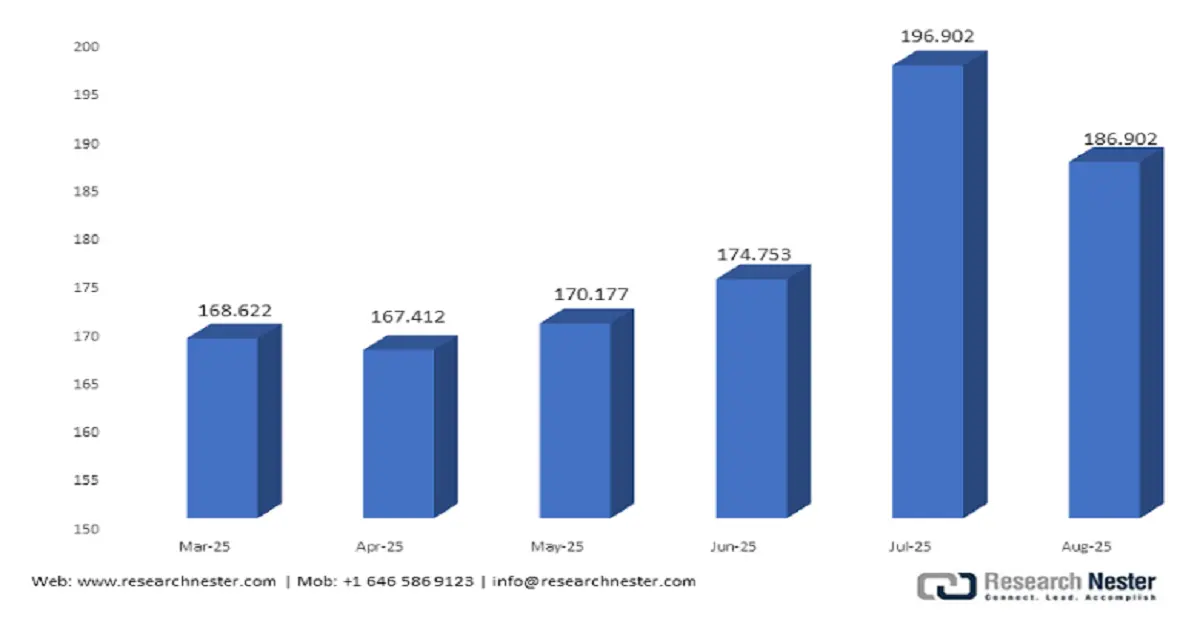
(Source: fred.stlouisfed.org)
The Producer Price Index of Electric Power Generation (Utilities) climbed between April and August 2025, with a high of 196.902 in July before registering a low of 186.902 in August. This fluctuation follows the rising renewable energy market, which habitually causes price volatility when starting a change in infrastructure. Primary production prices might also escalate in the short term as utilities add more renewable power and modify their grids and technologies, which is captured in the PPI. This trend highlights the interest of renewable energy in utility price regimes.
Capacity Trends
Total Renewable Energy Capacity in Asia, By Countries (2018–2024)
|
Year |
China |
India |
Japan |
Sri Lanka |
Indonesia |
|
2018 |
695,463 |
118,227 |
90,723 |
2,181 |
9,807 |
|
2019 |
758,870 |
128,475 |
98,685 |
2,332 |
10,303 |
|
2020 |
896,412 |
134,774 |
107,935 |
2,457 |
10,465 |
|
2021 |
1,017,852 |
147,390 |
115,170 |
2,723 |
11,533 |
|
2022 |
1,156,126 |
163 213 |
122,922 |
2 929 |
12,596 |
|
2023 |
1,453,701 |
175 684 |
128,782 |
3 110 |
13,325 |
|
2024 |
1,827,270 |
204,292 |
132,317 |
3,612 |
14,295 |
(Source: irena.org)
Total Renewable Energy Capacity in Europe, By Countries (2018–2024)
|
Year |
UK |
Germany |
France |
Switzerland |
Denmark |
|
2018 |
43 906 |
117 782 |
50 090 |
17 414 |
8,902 |
|
2019 |
46 664 |
123 641 |
52 819 |
17 753 |
9,180 |
|
2020 |
47 828 |
129 800 |
55 055 |
18 236 |
9,656 |
|
2021 |
49 600 |
136 502 |
58 534 |
18 882 |
10,867 |
|
2022 |
53 406 |
142 842 |
62 080 |
20 851 |
12,167 |
|
2023 |
56 127 |
159 886 |
67 447 |
22 630 |
12,779 |
|
2024 |
58 247 |
178 655 |
74 340 |
24 344 |
13,539 |
(Source: irena.org)
Challenges
- Expensive Environmental Compliance Costs: In the United States, the chemical producers of renewable energy face high environmental compliance costs, which are disproportionately high among small and medium-sized enterprises (SMEs). The U.S. Environmental Protection Agency (EPA) estimates the average compliance cost in chemical manufacturing plants to be around USD 10.7 million, with a range of USD 7.2 million based on the size of the plant and the complexity of its production operations. These expenses add emission control, waste management, and reporting costs, which pose a barrier to entry. For example, ill-equipped manufacturers tend to stay behind in implementing renewable chemical technologies because of short-term capital, which prevents renewable energy market growth and slows down the process of sustainable production development.
- Complicated Interconnection Standards: Interconnection standards of renewable energy systems are fragmented and divided, creating significant complications for manufacturers seeking to connect their products to power grids. Lack of standardization between states may lead to delay, extra engineering and certification, and compliance costs. For example, manufacturers could be required to conduct numerous site-specific tests or redesign equipment to fit different technical applications. This makes it difficult to deploy quickly and less competitive than traditional energy technologies. According to the EPA, standardization and simplified interconnection processes are essential to accessing the renewable energy market and speeding up the uptake of renewable energy.
Renewable Energy Market Size and Forecast:
| Report Attribute | Details |
|---|---|
|
Base Year |
2025 |
|
Forecast Period |
2026-2035 |
|
CAGR |
12.3% |
|
Base Year Market Size (2025) |
USD 1.2 trillion |
|
Forecast Year Market Size (2035) |
USD 3.8 trillion |
|
Regional Scope |
|
Renewable Energy Market Segmentation:
Grid Mode Segment Analysis
On-grid segment is expected to grow with the largest renewable energy market share of 72.4% by 2035. It enables massive incorporation of renewable energy into national grids, which provides a steady and consistent supply of power. This growth is caused by policy stimulus and grid modernization programs such as smart grid implementation. According to the U.S. Energy Information Administration, in 2025, the U.S. anticipates 63 GW of new utility-scale electric capacity, 30% more than in 2024, with 81% of this new capacity coming through solar and battery storage, reflecting strong growth in the on-grid renewable sector, enhancing grid stability and decarbonization objectives. In addition, on-grid systems allow the transmission of energy efficiently at a relatively low cost, which increases access to energy and reduces fossil fuel dependence. With the economy shifting to cleaner energy, on-grid infrastructure will remain one of the dominant contributors to renewable market expansion.
Utility-scale grid-tied systems that provide large amounts of clean electricity to the grid, driving the On-grid segment effectively. In the U.S., 62.8 GW of additional utility-scale capacity was scheduled in 2024, with approximately 58 GW of solar to be installed, amidst a surge of solar projects in both Texas and California, making the grid more stable and the renewable content much higher. Distributed grid-tied systems, including rooftop solar and small systems, produce power at or near the point of need, minimizing transmission losses and offering greater resilience to the grid. Distributed solar makes up approximately a third of Arizona's solar generation and helps manage demand with smart grids and energy storage, contributing to the expansion of on-grid renewables by creating more local energy generation and increasing consumer engagement. The two subsegments play a critical role in supporting the rapid shift towards an electricity grid that is powered by renewable sources.
Deployment Mode Analysis
The greenfield deployment segment is projected to account for 64.3% during the forecast years, as it requires new large-scale renewable facilities on untapped lands, which are highly flexible and scalable. Governments are also promoting the development of green fields by offering incentives, tax credits, and easing permitting regulations to hasten the entry of renewable capacity. According to the IRENA World Energy Transitions Outlook 2022, the 1.5°C target will need more than USD 115 trillion of renewable investments by 2050, with greenfield projects necessary to augment utility-scale renewable capacity and infrastructure to fuel global clean energy utilization and climate ambitions. These projects help to boost the economy of the region, employment, and energy security, and lead to the transition to clean energy. The simplicity and scalability of greenfield deployments are required to achieve international renewable capacity goals by the year 2035.
The greenfield deployment segment is predominantly motivated by new utility-scale installations, and the U.S is predicted to add 12 GW of new utility-scale solar capacity in the first half of 2025 alone, and 21 GW more by the end of the year. In particular, these huge-scale projects, such as those in Texas and California, boost the supply of clean electricity and contribute to the decarbonization of the grid. Meanwhile, new distributed energy systems such as rooftop solar and paired storage also contribute to the segment’s growth. For example, California models anticipate fast growth of distributed photovoltaic systems with storage to improve grid flexibility and resilience to local energy sources. This type of distributed generation facilitates grid modernization and allows more consumers to be part of the energy transition. The combination of these subsegments propels scaled-up renewable capacity additions and strengthens the worldwide transition to sustainable energy infrastructure.
Type Segment Analysis
The solar energy segment is anticipated to grow steadily with a renewable energy market share of 46.8% during the projected years from 2026 to 2035, primarily due to cost reduction and technological changes, including higher efficiency and CAMIs, which are expected to drive this renewable energy market. A policy environment favorable to solar power production has been established globally, including in the U.S. and the EU, with governments establishing ambitious targets to expand their solar capacities. Additionally, the report by the International Renewable Energy Agency showed that the global solar photovoltaic power grew to 451.9 GW in 2024, with China and India contributing 278 GW and 24.5 GW, respectively. Such a huge boost highlights the leading position of solar energy in the acceleration of renewable energy. With these trends, the role of Solar in becoming decarbonized and ensuring energy security is a vital factor, driving the overall renewable energy growth.
Our in-depth analysis of the renewable energy market includes the following segments:
|
Type |
|
|
End-User |
|
|
Deployment Mode |
|
|
Grid Type |
|

Vishnu Nair
Head - Global Business DevelopmentCustomize this report to your requirements — connect with our consultant for personalized insights and options.
Renewable Energy Market - Regional Analysis
Asia Pacific Market Insights
The Asia Pacific is predicted to dominate the renewable energy market with the largest revenue share of 39.4% over the projected years from 2026 to 2035, primarily attributed to the swift industrialization, urbanization, and a heavy policy push towards clean energy. For example, the APEC area, which has 21 economies such as China, Japan, and India, with a total population of approximately 38% of the global population. Final energy consumption, power generation, and energy provision in the region contribute 57%, 50%, and 63% of the global total, respectively. In addition, developed countries such as China, India, and Japan are at the forefront with heavy investment in solar, wind, and hydroelectric power. Renewable energy incentives by governments, including feed-in tariffs and renewable energy targets, have prompted the uptake of renewable technologies. Moreover, there is an explosion of renewable energy chemical markets in the region, such as Gallium Arsenide (GaAs) wafers used in high-efficiency solar cells. The merging of smart grid technologies and energy storage systems also contributes to the reliability and efficiency of renewable energy systems. A combination of these factors makes APAC a force to be reckoned with in the world of renewable energy.
The renewable energy market in China is likely to hold the highest share of renewable energy in the Asia Pacific region by 2035. The power of China is its sheer scale of deployment and manufacturing: it is already the leading producer of solar PV, battery production, and wind turbines, and encompasses the overwhelming majority of module and inverter production lines. The Chinese government uses tools such as the National Development and Reform Commission (NDRC) five-year plans, subsidy mechanisms, and green industrial zones to direct investment towards renewables and related chemical industries (e.g., precursor materials, rare earths, hydrogen catalysts). In addition, the state planning in China is able to build large gigawatt-scale wind + solar farms with chemical value chains (e.g., silicon, polysilicon, battery precursor, electrolyzer catalysts). For example, in 2024, China produced 1.82 million tonnes of polysilicon, or an increase of 23.6% over the prior year. Its centralized grid and capital mobilization capability enable a fast scale-up. Demand is guaranteed by Chinese policies like the Dual Carbon objective (peak emissions by 2030, become carbon-neutral by 2060) as well as provincial green transition requirements. For instance, China aims to reach about 20% by 2025, 25% by 2030, and more than 80% by 2060. Moreover, it targets the reduction of carbon dioxide emissions per unit of GDP by 18% as of 2020, and over 65% as of 2030, in comparison with the 2020 level. It also seeks to ensure that by 2030, a total installed capacity of wind and solar power is more than 1,200 gigawatts. Accordingly, China will take the lion's share of the renewable energy revenues in APAC, and with its economies of scale and integrated supply chain, the country will solidify its position as a leader in this region.
India’s renewable energy market is anticipated to grow with the fastest CAGR from 2026 to 2035, fuelled by national and accelerated infrastructure investment. Domestic manufacturing of key materials (e.g., green hydrogen, electrolyzer catalysts, and advanced PV modules) is more and more funded by the government through ministries such as MNRE, DST, and the Ministry of Chemicals and Fertilizers, with chemical value chains being localized. For example, the total installed renewable energy capacity within the country has reached a record 220.10 GW, with an addition of 29.52 GW in the financial year 2024-25. The growing power demand, grid modernization, battery storage, and electrification of the industry all drive demand growth. The reforms in India to rooftop solar, competitive auction, and manufacturing incentive (PLI schemes) are drawing in private capital. Financing internationally (e.g., through multilateral development banks) and support through domestic policy alleviate risk. Moreover, the chemical sector in India is also fast-moving towards using more environmentally-friendly processes through FICCI/ICC initiatives, which have allowed renewables and chemicals to work together. For instance, the Indian chemicals and petrochemicals industry is expected to expand to USD 304 billion by 2025 at a CAGR of 9.3%. This is attributed to the fact that the industry has become more concerned with sustainability and green practices. Considering this continued trend, renewable energy (and the related chemical supply) in India will experience the highest CAGR in the region of APAC during the period.
North America Market Insights
The North American renewable energy market is anticipated to grow significantly with a revenue share of 25.7% over the forecast years by 2035, owing to the rising clean energy efforts in Mexico and the growing use of solar, wind, and biomass technologies in the area. For example, Mexico has shown commitment to renewable energy in its updated Nationally Determined Contributions (NDCs) under the Paris accord. The country seeks to realize a 35% cut in greenhouse gas (GHG) emissions by 2030, and a higher target of 40% with international support under UNDP Climate Promise. Additionally, by 2030, Mexico has set a goal of producing 40 gigawatts (GW) of clean energy, which has the potential to supply up to 30 million homes per year, UNDP Climate Promise. This growth is driven by government programs aimed at reducing carbon and using energy more efficiently, with international agreements as the support mechanism. The industrial sector is currently considering ways of incorporating renewable energy solutions to achieve both sustainability and cost reduction objectives. For instance, the global renewable energy sector directly and indirectly employed 13.7 million people in 2022, with solar photovoltaic, bioenergy, hydropower, and wind power as the main drivers, according to the International Renewable Energy Agency (IRENA). More renewable energy projects and updating the grid infrastructure are essential to maintain long-term growth.
The U.S. market is expected to dominate the North American region over the forecast years, attributed to the rising federal investments and technology in the country. In 2023, clean energy jobs increased by 4.9%, equivalent to 149,000 jobs, with the wind and solar sectors registering the highest percentage growth. In addition, with almost 2,000 active awards, the Department of Energy 2024 Investment Snapshot focuses on employment opportunities, economic development, and lower consumer energy expenses. In 2024, to boost domestic clean energy production, the DOE initiated a competition worth over USD 11 million through the MAKE IT Prize and a USD 32 million funding round to jumpstart clean energy innovation. These attempts are on the way toward the U.S. government meeting 100% clean electricity by 2035, and wind and solar energy sources are expected to provide 60% -80% of electricity generation in the lowest-cost electricity portfolio in 2035. The overall generation will expand to approximately three times the 2020 capacity and include a total of 2 terawatts of wind and solar.
The market in Canada is expected to grow significantly, driven by the governmental efforts and investments of the private sector. As of 2022, 16.9% of the total primary energy supply in Canada comes from renewable sources, of which hydroelectric power is the most common. The Clean Energy for Rural and Remote Communities Program saw the federal government spend CAD 220 million on funding projects that may help avoid the use of diesel fuel, as well as encourage clean energy solutions. Furthermore, Canada is developing hydrogen technology, and about 80 low-carbon production projects were announced involving more than 100 billion dollars of potential investments. These initiatives are within the wider Canadian plan to move to a low-carbon economy and energy security. Moreover, Canada's Clean energy gross domestic product is estimated to increase to CAD 107 billion in the next five years due to a combination of approximately CAD 58 billion a year of investment through 2030 and the creation of over 600,000 jobs.
Europe Market Insights
The European market is projected to grow at a notable rate during the forecast years. By 2022, the EU had installed 56 GW of wind and solar power, a 16% growth over 2021, and the figure is estimated to grow to 73 GW in 2023. The overall renewable energy potential in the EU is nearly 480 GW, saving an estimated 13 bcm of natural gas. The EU has a renewable energy target of at least 42.5% in 2030, and is expected to achieve 45%. Additionally, as of 2022, the European Union consisted of 23% renewable energy. In its 2028-2034 budget proposal, the European Commission projects high investment in renewable energy infrastructure and innovation to increase energy security in Europe and mitigate greenhouse gas emissions. Transparency and efficiency are growing thanks to technological advancements, including the adoption of digital platforms and blockchain in renewable energy certificate markets. Furthermore, the low-carbon and renewable energy economy (LCREE) in the UK has a turnover of £67.5 billion in 2023, with a workforce of around 314,300 full-time equivalents (FTEs). Additionally, in 2022, renewables constituted 17% of all power in Germany. The share of renewable energy in final energy consumption is 21% and the biomass constitutes about 55% of renewable energy.
Key Renewable Energy Market Players:
- Iberdrola SA
- Company Overview
- Business Strategy
- Key Product Offerings
- Financial Performance
- Key Performance Indicators
- Risk Analysis
- Recent Development
- Regional Presence
- SWOT Analysis
- GE Vernova
- NextEra Energy
- Constellation Energy Corp.
- Enel Spa
- Acciona
- Vestas Wind Systems
- Siemens Energy
- Adani Green Energy
- Blueleaf Energy
- Tata Power
- Samsung SDI
- Canadian Solar Inc.
- Orsted
- JinkoSolar
The global renewable energy market is marked by rapid growth and high competition between the most successful producers, representing different regions such as the USA, Europe, and Asia. Major participants such as Iberdrola, GE Vernova, NextEra Energy, and Adani Green Energy are exploiting wind, solar, and battery technology innovations and ambitious capacity builds. The focus of strategic initiatives is based on carbon neutrality goals, the adoption of AI and smart grid applications, region diversification, and the development of mergers/acquisitions to unify operations. Additionally, investment is promoted by strong government policies and corporate sustainability commitments, resulting in a dynamic and fragmented marketplace with an emphasis on technological leadership and geographic reach. This competitive ecosystem can facilitate faster decarbonization and serve soaring demand in residential, commercial, and industrial markets in the global renewable energy market.
Top Global Renewable Energy Manufacturers are:
Recent Developments
- In April 2025, Toyota Motor Corporation and Daimler Truck AG concluded the definitive agreement aimed at the integration of Mitsubishi Fuso and Hino Motors; this would create a single commercial automotive giant. In this strategic merger, the company seeks to improve its competitiveness in the Asia-Pacific market through the consolidation of development, procurement, and production. The new holding company, which is scheduled to start operating in April 2026, will be listed on the Tokyo Stock Exchange. The combined organization employs more than 40,000 people and aims to become a sustainable mobility leader in the areas of carbon neutrality and optimized logistics. The partnership emphasizes the desire to achieve the development of electric, hydrogen, and autonomous vehicles as part of global decarbonization objectives.
- In February 2025, Tinda Energy launched the 65 MW Ignié Solar Plant in the Republic of Congo. The project is in the Ignié Special Economic Zone (SEZ) and includes a 55 MW hybrid solar plant and a 10 MW biomass plant. The solar part will start operating in 2025, with the biomass facility likely to come online toward the end of 2026. The project will power the Ignié SEZ and reinforce the national electric grid, contributing to the industrial production, including the manufacturing of PVC pipes and sanitary equipment. Tinda Energy has contracted Chinese engineering company Complant and Turkish group Abosskal Oferka to supply equipment and interconnection infrastructure. Institutions such as Afreximbank and FSA are financially supporting it. The project is under an umbrella Tinda Energy Ignié 2021-2046 program that aims to increase renewable energy capacity in the area.
- In July 2024, Essar Energy Transition (EET) announced the establishment of EET Hydrogen Power, the first 100 percent hydrogen-fueled combined heat and power (CHP) plant in Europe, which will come online by 2027. The plant will be at the Stanlow refinery in the UK and will provide 125 MW of power and 6,000 tonnes of steam per day to replace existing hydrocarbon-based boilers. The shift will see a reduction of carbon dioxide emissions by 740,000 tonnes each year. The project forms part of a wider 3.0 billion energy transition investment in the North West of England, reflecting the UK's aims at decarbonization and the HyNet industrial cluster.
- Report ID: 1094
- Published Date: Oct 31, 2025
- Report Format: PDF, PPT
- Explore a preview of key market trends and insights
- Review sample data tables and segment breakdowns
- Experience the quality of our visual data representations
- Evaluate our report structure and research methodology
- Get a glimpse of competitive landscape analysis
- Understand how regional forecasts are presented
- Assess the depth of company profiling and benchmarking
- Preview how actionable insights can support your strategy
Explore real data and analysis
Frequently Asked Questions (FAQ)
Renewable Energy Market Report Scope
Free Sample includes current and historical market size, growth trends, regional charts & tables, company profiles, segment-wise forecasts, and more.
Connect with our Expert


Copyright @ 2026 Research Nester. All Rights Reserved.
