Onshore Oil & Gas Pipeline Market Outlook:
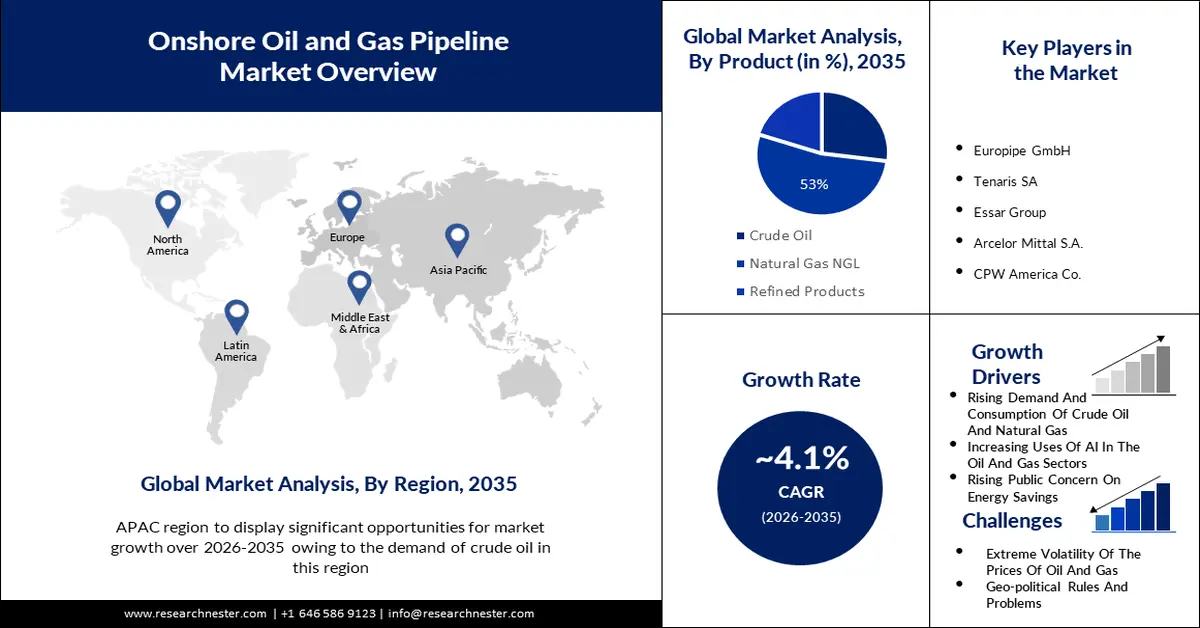
Onshore Oil & Gas Pipeline Market size was over USD 68.16 billion in 2025 and is anticipated to cross USD 101.87 billion by 2035, growing at more than 4.1% CAGR during the forecast period i.e., between 2026-2035. In the year 2026, the industry size of onshore oil & gas pipeline is assessed at USD 70.68 billion.
The primary factor that will drive the growth of the onshore oil & gas pipeline market is the extreme demand for oil and gas pipelines in different industries worldwide. As of November 2023, there were 797 land rigs in different world regions, with 22 rigs situated offshore. The number of international oil rigs accelerated remarkably in 2022, as authorizations on Russian exports and greater complete requirements led to more investigation activity in the world. Moreover, in 2025, it is anticipated that 28 percent of the crude oil generated internationally will be manufactured offshore, while the rest 72 percent of crude oil will be generated onshore.
Increasing energy consumption is raising the consumption of oil and gas pipelines and the onshore oil & gas pipeline market is anticipated to show a significant growth rate during the forecast period due to this. As of 2022, energy consumption is still about 80% from fossil fuels. The Gulf States and Russia are major energy traders, with important consumers being the European Union and China, where internally sufficient energy is generated to gratify energy requirements. Energy consumption generally increases about 1-2% per year, apart from solar and wind energy which middle 20% per year in the 2010s. The energy system has converted drastically since the Industrial Revolution. People noticed this conversion of the international energy supply in the communicative chart demonstrated here. It graphs international energy consumption from 1800 forwards. It is dependent on historical calculations of primary energy consumption from Vaclav Smil, as well as updated figures from BP's Statistical Review of World Energy.
Key Onshore Oil and Gas Pipeline Market Insights Summary:
Regional Highlights:
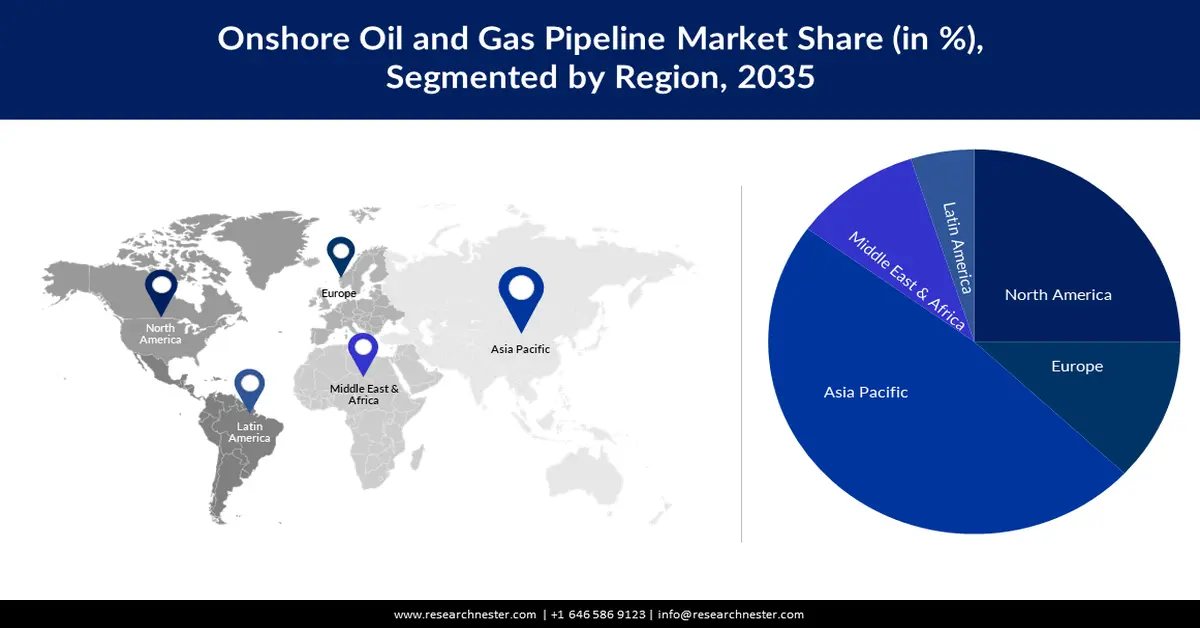
- Asia Pacific onshore oil & gas pipeline market will hold more than 48% share by 2035, driven by the increase in oil and gas pipeline requirements in the region.
- North America market will exhibit substantial growth during the forecast timeline, driven by the accelerated production of crude oil and natural gas.
Segment Insights:
- The natural gas ngl segment in the onshore oil & gas pipeline market is forecasted to secure a 53% share by 2035, fueled by increased use of natural gas in power generation and transportation.
- The upstream segment in the onshore oil & gas pipeline market is expected to experience significant growth through 2035, driven by the growing number of global upstream oil and gas projects.
Key Growth Trends:
- Increasing Uses of AI in The Oil and Gas Sectors
- Increasing Public Awareness About Energy Protection
Major Challenges:
- Fluctuation in The Price of The Oil And Gas
- Geo-Political Regulations and Issues
Key Players: Europipe GmbH, Tenaris SA, Essar Group, Arcelor Mittal S.A., CPW America Co., Vallourec S.A., JFE Steel Corporation, American Cast Iron Pipe Company, Jiangsu Chang bao Steel Tube Co. Ltd., MetalurgicaGerdau S.A., Japex Pipeline Ltd., GEOSYS, Inc., TOHOKU NATURAL GAS Co., Inc., Fukushima Gas Power Co., Ltd.
Global Onshore Oil and Gas Pipeline Market Forecast and Regional Outlook:
Market Size & Growth Projections:
- 2025 Market Size: USD 68.16 billion
- 2026 Market Size: USD 70.68 billion
- Projected Market Size: USD 101.87 billion by 2035
- Growth Forecasts: 4.1% CAGR (2026-2035)
Key Regional Dynamics:
- Largest Region: Asia Pacific (48% Share by 2035)
- Fastest Growing Region: Asia Pacific
- Dominating Countries: United States, China, Russia, Canada, Australia
- Emerging Countries: China, India, Japan, South Korea, Brazil
Last updated on : 16 September, 2025
Onshore Oil & Gas Pipeline Market Growth Drivers and Challenges:
Growth Drivers
- Increasing Uses of AI in The Oil and Gas Sectors - The report notes organizations leading the implementation of AI in the integrated oil and gas sector, recognizing Chevron, Ecopetrol, Petrobras, Reliance Industries, Repsol, Rosneft, Saudi Aramco, Shell, and BP as names of record. BP specifically has a history of spending on AI. The organization collaborated with Microsoft Azure as soon as 2017, implementing Machine Learning (ML) to facilitate drilling techniques. In 2020, it worked in Bluware, implementing a depth study for subsurface information interpretation. More currently, in May 2023, Poweverse – an energy technology developed by Lightsource BP – commenced its AI-powered home energy management platform for domestic customers. GlobalData also recognizes multiple laggards that are dropping behind in understanding AI’s possible. These comprise CNPC, MOL, ONGC, PKN Orlen, and QatarEnergy.
- Increasing Public Awareness About Energy Protection - With the advancement of their economic expansion, appearing countries are increasingly attributing to a larger portion of the international energy requirement. This shows not only an enhanced requirement but also an increasing possibility for the largest energy productivity scopes of the future to be found in appearing and growing countries. In Africa, energy productivity has an important role in the continent's growth and economic development, acting concurrently as a stimulus and expediter for global energy availability within the region.
- Increasing Government Campaigns to Motivate People to Save Energy -Well-designed campaigns can influence people to limit their energy utilization. The IEA’s 2021 report The Potential of Behavioural Interventions for Optimizing Energy Use at Home demonstrates that campaigns can acquire an extensive range of influences in terms of amounts of energy safeguard. Even beyond today’s energy crisis, IEA modeling highlights the significance of behavioral steps for receiving net-zero targets. Governments are answering with multiple measures comprising aimed grants and demand-limitation campaigns. At the IEA’s current 7th Annual Global Conference on Energy Efficiency, energy ministers from worldwide accepted that energy effectiveness and demand-side action have a specifically significant role to play now
Challenges
- Fluctuation in The Price of The Oil And Gas - The International Energy Agency's (IEA) most current oil market report shows a substantial downturn in market sentiment in November and December, when robust oil supply from non-OPEC+ countries overlapped with delaying international oil demand expansion. The outcome was that, by December, oil prices had declined around USD 25/bbl from September to their lowest levels in six months. As of the time of writing, Brent Crude was commercializing at USD 80.21/bbl, whilst WTI Crude Oil was commercializing at USD 75.00. At the same time, in the gas sector, prices continued to notice fluctuation; since Russia’s incursion into Ukraine in February 2022, the onshore oil & gas pipeline market has noticed issues, although the proportionate balance is presented by higher storage levels in Europe. Gas consumption is set to decline, as markets in Europe, the US, and Asia-Pacific turn growing to sustainable energy. The IEA projects Eurasia’s requirement to stand only 2% above its 2021 level by 2026.
- Geo-Political Regulations and Issues
- Protests from Local Communities
Onshore Oil & Gas Pipeline Market Size and Forecast:
| Report Attribute | Details |
|---|---|
|
Base Year |
2025 |
|
Forecast Period |
2026-2035 |
|
CAGR |
4.1% |
|
Base Year Market Size (2025) |
USD 68.16 billion |
|
Forecast Year Market Size (2035) |
USD 101.87 billion |
|
Regional Scope |
|
Onshore Oil & Gas Pipeline Market Segmentation:
Product Segment Analysis
Onshore oil & gas pipeline market from the natural gas NGL segment is slated to account for 53% of the revenue share by 2035. This growth will be noticed primarily due to the increased use of natural gas in different sectors involving power generation and transportation. The transport segment alone can contribute to over 50% of the costs generated through the value chain of globally traded natural gas. As an outcome, natural gas NGL and compressed natural gas CNG tanks remained for a long time a local commodity, used up comparatively close to its production centers. In the Asia Pacific’s journey towards a more tenable future, LNG appears as a key agent, presenting a bridge to balance, flexibility, and decarbonization. Additionally, the biggest gas-to-wire project is recently constructed in Brazil in the Açu port of Rio de Janeiro. The project incorporates a 1.3GW blended cycle plant united into an LNG regasification terminal, a transportation line, and a substation linked to the national grid.
Sector Segment Analysis
In this segment, the upstream segment in the onshore oil & gas pipeline market is expected to hold 45% of the revenue share by the end of 2035 owing to the increasing upstream project of oil and gas across the world. A total of 789 oil and gas upstream projects are projected to initiate operations from 2023 to 2027. Of these 520 are latest build projects and 269 are developments of existing fields. Asia commands among the regions with more than 180 projects projected to begin operations by 2027. Oil and gas research encircles the techniques and methods included in locating possible sites for oil and gas drilling and lineage. Early oil and gas discoveries depended upon surface symptoms such as natural oil seeps, but advancements in science and technology have made oil and gas research more efficient. Geological surveys are executed by implementing different measures from testing subsoil for onshore research to utilizing seismic imaging for offshore exploration.
Our in-depth analysis of the global onshore oil & gas pipeline market includes the following segments:
|
Type |
|
|
Product |
|
|
Application |
|
|
Sector |
|

Vishnu Nair
Head - Global Business DevelopmentCustomize this report to your requirements — connect with our consultant for personalized insights and options.
Onshore Oil & Gas Pipeline Market Regional Analysis:
APAC Market Insights
The onshore oil & gas pipeline market in the APAC market has the largest share and will also hold that position with almost 48% share. The oil and gas requirement centers provide an increase in the requirement for a cost-efficient and protected mode of shipping. The possibility of CCUS is focused on the Asia–Pacific region. The region has more than 1,300 emitter organizations and more than 20 possible hubs. Five years ago, only two of 23 operational projects worldwide were in this region, but this number has surpassed tripled. There are now nine CCUS conveniences operating in the region, mainly in China and Australia, concentrated on the segregation of discharges from natural gas processing and the chemical sector.
North American Market Insights
North America region is anticipated to observe substantial growth through 2035. The developing oil and gas drilling activities will take to the accelerated production of crude oil and natural gas which requires to be transported through pipelines from the wellhead to accumulation stations and processing capabilities, and from there, to refineries and tanker loading capabilities owing to the increasing growth in this region. Moreover, average US oil production touched 12.8 million bbl/day in 2023, increased by 6.9% from last year. Next year, it’s anticipated to remain at the same level. Gas generation was at 103.0 billion cu ft/day in 2023, a 5.0% development from last year, and according to the forecast that generation will be only somewhat higher in 2024, touching 103.1 billion cu ft/day. Basically, pipelines are needed to transport crude oil and natural gas over long distances.
Onshore Oil & Gas Pipeline Market Players:
- Europipe GmbH
- Company Overview
- Business Planning
- Main Product Offerings
- Financial Execution
- Main Performance Indicators
- Risk Analysis
- Recent Development
- Regional Presence
- SWOT Analysis
- Tenaris SA
- Essar Group
- Arcelor Mittal S.A.
- CPW America Co.
- Vallourec S.A.
- JFE Steel Corporation
- American Cast Iron Pipe Company
- Jiangsu Chang bao Steel Tube Co. Ltd.
- MetalurgicaGerdau S.A.
Recent Developments
- Virginia natural gas company RGC Resources Inc.'s chief executive expressed that the joint project building the USD 5.8 billion-USD 6.0 billion Mountain Valley gas pipeline from West Virginia to Virginia has finished the project by the end of 2021. That parallels what other organizations included in the project have expressed since they determined in January to renounce a nationwide license that encircled all stream crossings and rather ask individual licenses to cross the continuing approximately 430 streams.
- Tenaris S.A. declared that it has entered into an explanative deal to gain from Mattr (MATR.TO) 100% of the shares of its subsidiary Bredero Shaw International BV, which gets Mattr’s pipe coating business, for USD 166 million (involving working capital), on a cash-free, debt-free basis, subject to traditional price adjustments. The business being gained comprises nine plants situated in Canada, Mexico, Norway, Indonesia, the UAE, and the US, and multiple mobile tangible plants. The business also comprises world-class R&D facilities in Toronto and Norway and an extensive IP/product portfolio.
- Report ID: 5534
- Published Date: Sep 16, 2025
- Report Format: PDF, PPT
- Explore a preview of key market trends and insights
- Review sample data tables and segment breakdowns
- Experience the quality of our visual data representations
- Evaluate our report structure and research methodology
- Get a glimpse of competitive landscape analysis
- Understand how regional forecasts are presented
- Assess the depth of company profiling and benchmarking
- Preview how actionable insights can support your strategy
Explore real data and analysis
Frequently Asked Questions (FAQ)
Onshore Oil and Gas Pipeline Market Report Scope
Free Sample includes current and historical market size, growth trends, regional charts & tables, company profiles, segment-wise forecasts, and more.
Connect with our Expert


Copyright @ 2026 Research Nester. All Rights Reserved.
