Industrial Silica Sand Market Outlook:
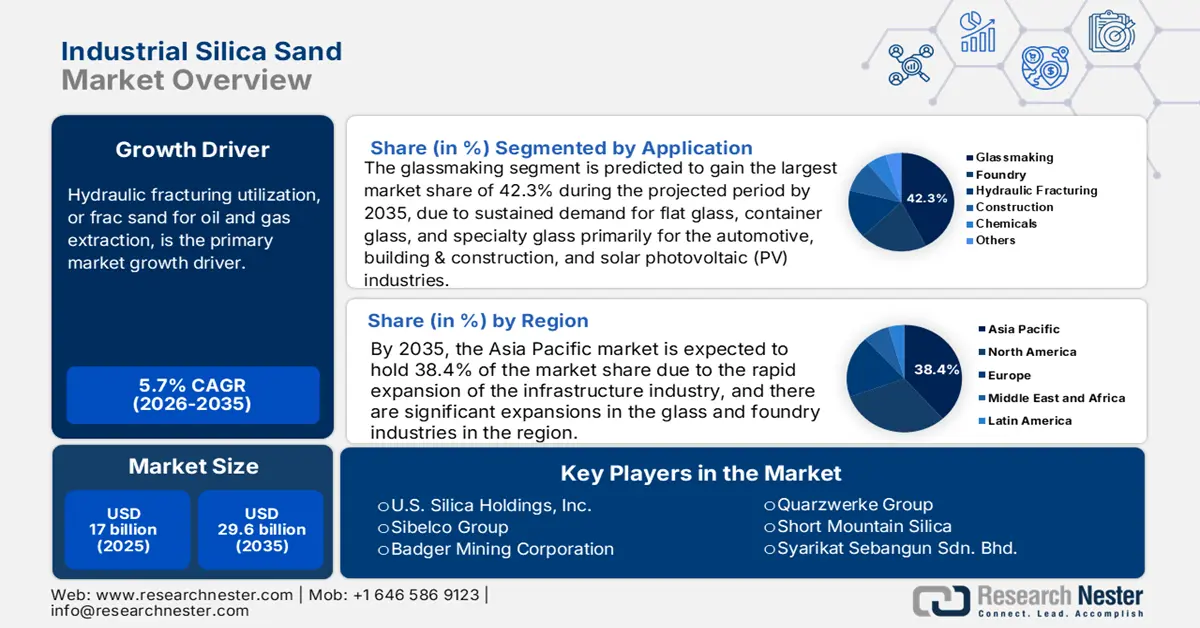
Industrial Silica Sand Market size was estimated at USD 17 billion in 2025 and is expected to surpass USD 29.6 billion by the end of 2035, rising at a CAGR of 5.7% during the forecast period, i.e., 2026-2035. In 2026, the industry size of industrial silica sand is assessed at USD 17.9 billion.
Hydraulic fracturing utilization, or frac sand for oil and gas extraction, is the primary market growth driver. U.S. Geological Survey reported that frac sand led the way for a 11% increase in total industrial sand demand - 120 MM tons in 2023 - due to greater sand per well consumption and increased shale production. U.S. exports of industrial sandstone, including frac sand, increased by 18% in 2023 to approximately 7.5 MM tons, making the total national tonnage net exports, while demonstrating the world's reliance on the quality and processing sophistication of U.S. sand.
In 2023, U.S. industrial sand and gravel production reached 130 million tons and was valued at USD 7.0 billion. 106 companies produced industrial sand and gravel across 33 States and the top States were Texas, Illinois, Wisconsin, Louisiana, Missouri, Oklahoma, Arkansas, California, Michigan, and Iowa. The cumulation yield generated from these States was 89% of the overall domestic sales and use. Moreover, roughly 81% of the U.S. tonnage was utilized as hydraulic-fracturing sand and cementing sand, whereas 8% was used as glassmaking sand. Foundry sand, filtration sand, whole grain fillers, and recreational sand ascribed to 7% of the utilized quantity. Other miscellaneous uses included chemicals, abrasives, roofing granules, ceramics, filtration gravel, silicon and ferrosilicon fillers, traction, and metallurgical flux, which held a 2% combined share, and another 2% were other unspecified applications. The raw materials supply is based on high-purity quartz reserves largely from hard rock mining operations, with U.S. quartz production remained steady at 200 kto between 2022 and 2023, according to the USGS 2024 report.
Industrial Sand & Gravel Salient Statistics (Data in Thousand Metric Tons)
|
Key Attributes: Industrial Sand containing 95% or more silica and <= 0.6% iron oxide |
2019 |
2020 |
2021 |
2022 |
2023 |
|
Sold or used |
108,000 |
75,800 |
91,200 |
114,000 |
130,000 |
|
Imports |
389 |
417 |
350 |
338 |
290 |
|
Exports |
5,590 |
4,070 |
5,400 |
6,350 |
7,500 |
|
Consumption |
103,000 |
72,100 |
86,200 |
108,000 |
120,000 |
|
Price, dollars/ metric ton |
46.00 |
29.50 |
40.80 |
45.30 |
54.00 |
|
Employment, quarry & mill |
7,500 |
4,500 |
5,300 |
6,000 |
6,100 |
Source: USGS