Industrial Silica Sand Market - Regional Analysis
Asia Pacific Market Insights
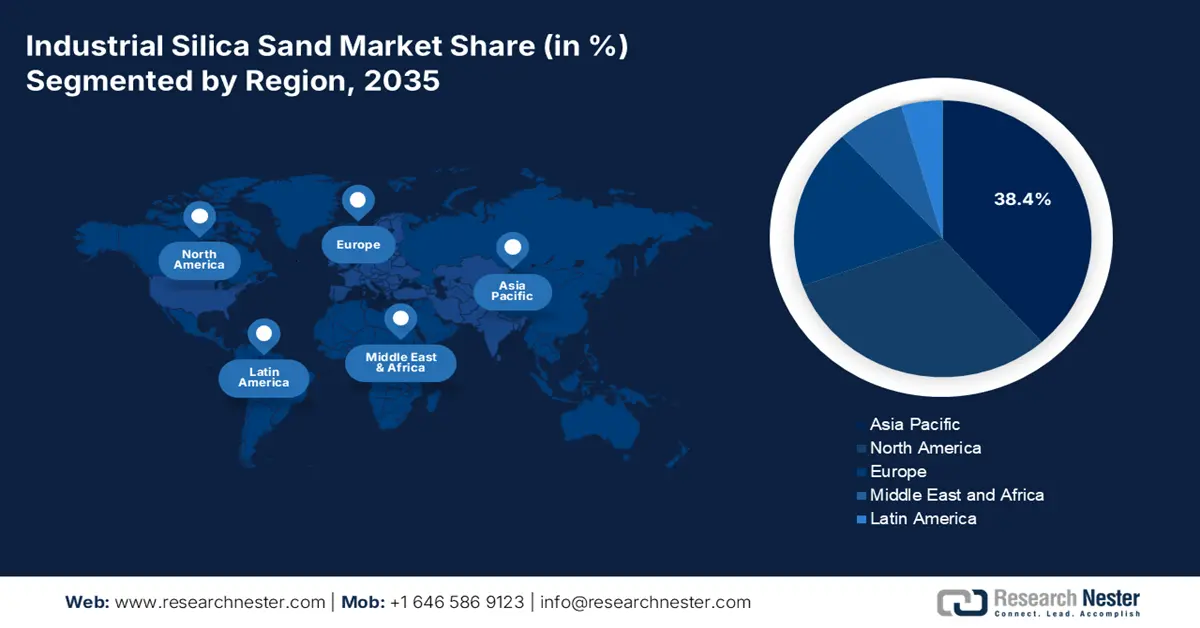
By 2035, the Asia Pacific market is expected to hold 38.4% of the market share due to the rapid expansion of the infrastructure industry, and there are significant expansions in the glass and foundry industries in the region. The required silica sand is driven by Chinese demand, followed by India and Japan. The increased manufacturing of electronics and solar PV in Southeast Asia also enhances consumption. Sustained construction government spending in ASEAN nations will also elevate longer-term demand.
China dominates the market with a massive consumption of industrial silica sand, dominated by usage in glass, solar panels, and foundries. China's dominant position in photovoltaic manufacturing and flat glass manufacturing is the driving force for high silica sand demand. China is among the top three exporters of glass globally, owing to its high production capacity. According to a 2023 USITC report, new projects in the country were estimated to add 655,000 metric tons of annual new silicon metal capacity in Xinjiang and Inner Mongolia in 2022.
Silicon Metal: Quantity Of Exports from China, By Destination and Period (Quantity in short tons)
|
Destination Market |
2017 |
2018 |
2019 |
2020 |
2021 |
2022 |
|
Japan |
208,538 |
221,296 |
181,465 |
169,068 |
206,231 |
160,945 |
|
South Korea |
164,728 |
148,065 |
128,121 |
89,171 |
98,556 |
91,215 |
|
United Arab Emirates |
55,926 |
61,505 |
51,915 |
31,667 |
64,657 |
67,272 |
|
India |
57,260 |
64,592 |
57,144 |
56,093 |
65,993 |
65,722 |
|
Thailand |
72,887 |
52,767 |
55,147 |
63,236 |
78,028 |
54,345 |
|
Malaysia |
35,496 |
40,326 |
42,788 |
48,446 |
60,906 |
42,980 |
|
Netherlands |
37,284 |
34,720 |
30,186 |
25,012 |
39,767 |
40,945 |
|
Mexico |
35,184 |
34,893 |
30,113 |
25,447 |
25,778 |
28,230 |
|
Bahrain |
13,320 |
18,760 |
18,858 |
11,622 |
24,259 |
25,143 |
|
Qatar |
25,512 |
21,482 |
17,678 |
18,814 |
22,991 |
20,029 |
|
All other markets |
217,543 |
200,361 |
152,139 |
141,111 |
170,201 |
120,798 |
Source: USITC
India's industrial silica sand market is forecasted to hold a staggering revenue share during the analysis timeline. The strong construction sector growth is a significant driver, as would be the continuing expansion of glass production and the growth of the ceramics industry. Additionally, the government of India is introducing significant initiatives such as the PMAY scheme (Housing for All), and subsequent infrastructure corridors will elevate the consumption of silica sand. With India's focus on ramping up solar PV manufacturing, the consumption of high-purity silica sand will further increase.
North America Market Insights
North America industrial silica sand market is expected to hold 31.1% of the market share during 2026-2035. The glass manufacturing, hydraulic fracturing, and foundry industries drive demand for engineered quartz, glass, and hydraulic fracturing sands. The United States of America accounted for most regional production, with steady imports to Canada for glass and construction applications.
The industrial silica sand market in the U.S. is driven by the strong shale gas exploration, especially through hydraulic fracturing, glass production, and demand in solar PV glass. The domestic production in 2023 was primarily concentrated in Illinois, Texas, and Wisconsin, thus, driving the market. Frac sand, as it is still required for the lease of new shale gas developments, is the main sub-segment. The steady construction demand in the US energy and foundry sectors has also propelled solid growth.
The industrial silica sand market in Canada was estimated to grow due to a robust growth in glass manufacturing, construction, and oil sands processing. Fairly steady imports assist domestic production, especially when sourcing high-purity sand needed for float glass and chemical applications, with imports to Canada primarily from Ontario and Alberta. The Canadian market is projected to grow at a stable CAGR over the assessed timeline, resulting from Canada’s significant planned infrastructure investments and its emerging clean energy glass applications.
Europe Market Insights
The European market is expected to hold 18.7% of the market share due to major contributors to ethanol production being construction, glass production, and the foundry industries. The construction and demand from the automotive and electronics sectors drove demand in Germany and the UK. Consumption and production patterns traced through Member States are influenced by greater use of renewable energy, glass panels, increasing available capital, and new workplace silica dust laws under the EU OSH framework.
In 2025, Germany's market led in value due to quality production glass, the manufacture of solar photovoltaic panels, the use of foundry sand in automotive casting, and because Germany produced more than 10 million tonnes of silica sand in 2024. The silica sand deal has long contributed to process innovation in manufacturing in the automotive industry, and is driving demand for premium silica sand for manufacturing excellence.