Hydrogen Generation Market Outlook:
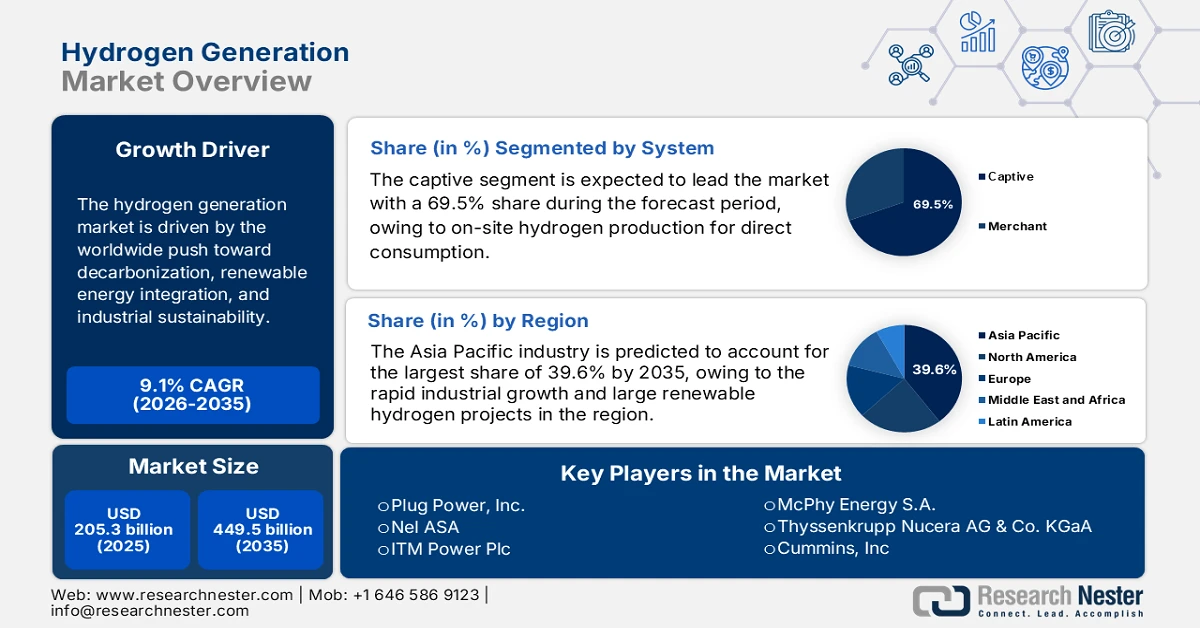
Hydrogen Generation Market size was valued at USD 205.3 billion in 2025 and is projected to reach USD 449.5 billion by the end of 2035, growing at a CAGR of 9.1% during the forecast period, i.e., 2026-2035. In 2026, the industry size of hydrogen generation is estimated at USD 223.9 billion.
The hydrogen generation market is driven by the worldwide push toward decarbonization, renewable energy integration, and industrial sustainability. Green hydrogen is viewed as a key solution for hard-to-electrify sectors such as steel, refining, chemicals, and heavy transportation. As per the article published by IEA, the worldwide hydrogen demand reached nearly 100 million tonnes in 2024, with most production still reliant on fossil fuels without emissions capture, and traditional sectors such as oil refining remaining the largest consumers. It also mentioned that low-emissions hydrogen currently represents less than 1% of total supply but is projected to grow to around 4% by the end of 2030, driven by policy support and technology deployment, hence denoting a positive hydrogen generation market outlook. Moreover, accelerated action on demand creation, infrastructure development, and regulatory clarity is essential to scale low-emissions hydrogen, particularly for hard-to-abate sectors.
Furthermore, tax credits, collaborations between governments, energy companies, and technology providers are strengthening the supply chain in the hydrogen generation market. In January 2025, the U.S. Department of the Treasury and IRS released final rules for the Section 45V Clean Hydrogen Production Tax Credit by providing clarity and flexibility for producers using electricity, natural gas with carbon capture, renewable natural gas, and coal mine methane. It also notes that these rules establish lifecycle emissions standards, investment certainty, and pathways for incremental clean electricity, enabling both electrolytic and methane-based hydrogen projects to qualify. By incorporating safeguards, hourly accounting options, and updated methodologies for methane leakage and alternative feedstocks, the regulations aim to accelerate deployment of clean hydrogen, support low-carbon industrial sectors, and strengthen the U.S. position in the global hydrogen economy.
Key Statistics and Infrastructure Metrics for U.S. Hydrogen Hubs and Demonstration Projects (2022-2023)
|
Category |
Data / Value |
|
DOE Regional Clean Hydrogen Hubs Grants |
USD 7 billion allocated for 7 finalists |
|
Total IIJA Appropriation for Hydrogen Hubs |
USD 8 billion (includes USD 1 billion for Demand-side Support Initiative) |
|
Number of Finalists for Regional Hubs |
7 |
|
Minimum Non-Federal Cost Share Required |
50% |
|
Execution Timeline for Hub Projects |
8-12 years |
|
Current U.S. Hydrogen Pipeline Length |
1,600 miles |
|
U.S. Natural Gas Pipeline Length (for comparison) |
300,000 miles |
|
Hydrogen Refueling Stations in California (as of June 30, 2023) |
65 public retail (light-duty) + 6 heavy-duty |
|
Planned Additional Stations in California |
35 light-duty + 4 heavy-duty + 5 multi-use |
|
Registered FCEVs in the U.S. (End of 2022) |
14,900 |
|
Cumulative FCEV Sales / Lease (through Oct 25, 2023) |
>17,000 |
|
Material Handling Equipment (MHE) Hydrogen Units |
>60,000 (2023) |
|
DOE Loan Guarantee for Advanced Clean Energy Storage |
USD 504 million |
|
Electrolyzer Capacity at Delta, UT Facility |
220 MW |
|
Hydrogen Storage Capacity per Cavern |
5.5 million kg (110 GWh) |
|
Shore-to-Store Project Funding |
USD 41.4 million (project partners) + USD 41.1 million (CARB) |
Source: Congress.gov