Gas Engine Market Outlook:
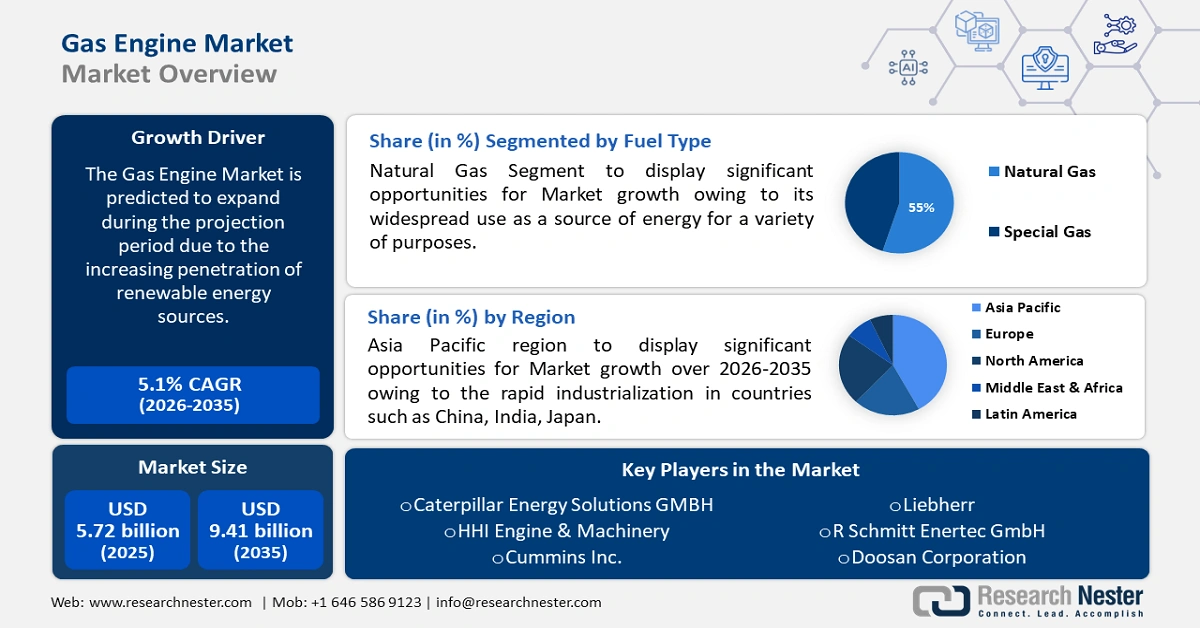
Gas Engine Market size was over USD 5.72 billion in 2025 and is projected to reach USD 9.41 billion by 2035, growing at around 5.1% CAGR during the forecast period i.e., between 2026-2035. In the year 2026, the industry size of gas engine is evaluated at USD 5.98 billion.
The gas engine market is predominantly driven by growing use of natural gas in several end use industries and the subsequent rise in its global trade. EIA estimates that non-OECD Asia to emerge as the largest importer of natural gas amounting to approximately 17 trillion cubic feet by 2050. In 2020, OECD Europe was the largest importer, followed by South Korea and Japan, and non-OECD Asia, including India and China. As per the IEO2021 Reference case, the U.S., Middle East, and Russia will continue to expand production through 2050, while the U.S. is projected to remain the largest producer globally, generating more than 43 trillion cubic feet (Tcf) in 2050 which will be a steep growth from 34 Tcf in 2020.
The U.S., the Middle East, and Russia have large proven reserves of both oil and natural gas, coupled with transportation and processing infrastructure to encourage international trade. LNG terminals and the availability of large-scale transportation vessels have created an outlet for natural gas to reach markets in Europe and Asia. Natural gas exports reached a record high of 6.90 trillion cubic feet in 2022 and the U.S. exports reached 46 countries. 44% of the U.S. natural gas exports were by pipeline, and 32% of those exports went to Canada and 68% were to Mexico.
Natural gas net exports by select countries in 2050 (trillion cubic feet)
|
Country |
Net export volume (Tcf in 2050) |
|
Russia |
14 |
|
The U.S. |
7 |
|
Middle East |
5 |
Source: EIA
Supportive policies including the Bipartisan Infrastructure Law and the Inflation Reduction Act (IRA) have rendered investments of over USD 154 billion into building automotive components. According to the U.S. Bureau of Labor Statistics (BLS), nearly 900,000 workforces manufacture large auto parts or components and assemble internal combustion engine vehicles at OEMs and Tier 1 suppliers. Supply chain employment linked to internal combustion engine vehicles comprising fuel injection systems often has a high displacement risk as more EVs are being manufactured. Of the 886,000 Tier 1 suppliers and OEM workers, around 58,000 workers cater to gasoline engines and its parts manufacturing is prone to job risks and competitiveness from the growing EV market. However, the booming global trade in natural gas and gas turbines is positively influencing the employment scenario in the gas engine market.
The global gas turbine trade was valued at USD 150 billion in 2022 and was the 21st most traded product worldwide. Gas turbine (inclusive of Gas turbine engines nes of a power > 5000 kW and Gas turbine engines nes of a power < 5000 kW) exports grew by 11.5% between 2021 and 2022, reaching from USD 135 billion to USD 150 billion and representing 0.63% of the overall global trade. The top exporters of gas turbines in 2022 were the U.S. (USD 32.5 billion), UK (USD 29.2 billion), France (USD 13.6 billion), Singapore (USD 8.48 billion), and Hong Kong (USD 7.92 billion). As per OEC, disaggregated by gas engine’s HS6 level, the most traded segments were turbo-jet engines of a thrust > 25 (USD 65.9 billion), parts of turbo-jet or turbo-propeller engines (USD 50.2 billion), parts for gas turbine engines (excl. turbo jet/prop) (USD 20.7 billion), Gas turbine engines nes of a power > 5000kW (USD 6.11 billion), and turbo-propeller engines of a power > 1000kW (USD 2.43 billion).