Global Gas Engine Market TOC
- An Introduction to the Research Study
- Market Definition
- Market Segmentation
- Industry Overview
- Assumptions & Abbreviations
- Research Methodology & Approach
- Research Process
- Primary Research
- Manufacturers
- Suppliers/Distributors
- End Users
- Secondary Research
- Market Size Estimation
- Summary of the Report for Key Decision Makers
- Forces of Market Constituents
- Factors/drivers impacting the growth of the market
- Market trends for better business practices
- Key Market Opportunities for Business Growth
- Major Roadblocks for the Market Growth
- Decarbonization Strategy and Carbon Credit Benefits for Market Players
- Global Government Decarbonization Plans/Goals by Each Country under 2015 Agreement Agreed by 200 Countries
- Measures taken by Countries to Reduce Carbon Footprints
- Carbon Credits and Subsidy Plans/Benefits Rolled out by the Government for Market Players
- Effective Ways to Harness Carbon-Credits and Impact on Profit Margins
- Demand Impact on the Companies Opting for Carbon Credits
- Government Regulation: How They Would aid Business
- Technology Transition and Adoption Analysis
- Internet of Things (IoT)
- Dual-Fuel Engines
- Turbochargers
- Industry Pricing Benchmarking & Analysis
- Industry Risk Analysis
- Global Economic Outlook: Challenges for Global Recovery and its Impact on Global Gas Engine Market
- Ukraine-Russia crisis
- Potential US economic slowdown
- Industry Value Chain Analysis
- Comparative Analysis of Gas Turbine and Gas Engine
- Case Study Analysis
- End-User Analysis
- Country Demand Analysis
- Product Comparative Analysis
- Competitive Positioning
- Competitive Landscape
- Global Gas Engine Market Outlook
- Market Overview
- Market Revenue by Value (USD Million) and Compound Annual Growth Rate (CAGR)
- Global Gas Engine Market Segmentation Analysis (2023 -2036
- By Fuel Type
- Natural Gas, Market Value (USD Million) and CAGR, 2023 -2036 F
- Special Gas, Market Value (USD Million) and CAGR, 2023 -2036 F
- Others, Market Value (USD Million) and CAGR, 2023 -2036 F
- By Fuel Type
- Global Gas Engine Market Segmentation Analysis (2023 -2036
- By Power Output
- Up to 100 kW, Market Value (USD Million) and CAGR, 2023 -2036 F
- 100 -300 kW, Market Value (USD Million) and CAGR, 2023 -2036 F
- 300 -500 kW, Market Value (USD Million) and CAGR, 2023 -2036 F
- More than 500 kW, Market Value (USD Million) and CAGR, 2023 -2036 F
- By Power Output
- Global Gas Engine Market Segmentation Analysis (2023-2036)
- By Application
- Power Generation, Market Value (USD Million) and CAGR, 2023-2036F
- Cogeneration, Market Value (USD Million) and CAGR, 2023-2036F
- Mechanical Drive, Market Value (USD Million) and CAGR, 2023-2036F
- Others, Market Value (USD Million) and CAGR, 2023-2036F
- By Application
- Global Gas Engine Market Segmentation Analysis (2023-2036)
- By End User
- Utilities, Market Value (USD Million) and CAGR, 2023-2036F
- Manufacturing, Market Value (USD Million) and CAGR, 2023-2036F
- Marine, Market Value (USD Million) and CAGR, 2023-2036F
- Oil & Gas, Market Value (USD Million) and CAGR, 2023-2036F
- Others, Market Value (USD Million) and CAGR, 2023-2036F
- By End User
- Global Gas Engine Market Segmentation Analysis (2023-2036)
- By Geography
- North America, Market Value (USD Million) and CAGR, 2023-2036F
- Europe, Market Value (USD Million) and CAGR, 2023-2036F
- Asia Pacific, Market Value (USD Million) and CAGR, 2023-2036F
- Latin America, Market Value (USD Million) and CAGR, 2023-2036F
- Middle East & Africa, Market Value (USD Million) and CAGR, 2023-2036F
- By Geography
- Cross Analysis of Fuel Type w.r.t. End-User
- North America Gas Engine Market Outlook
- Market Overview
- Market Revenue by Value (USD Million) and Compound Annual Growth Rate (CAGR)
- North America Gas Engine Market Segmentation Analysis (2023 -2036
- By Fuel Type
- Natural Gas, Market Value (USD Million) and CAGR, 2023 -2036 F
- Special Gas, Market Value (USD Million) and CAGR, 2023 -2036 F
- Others, Market Value (USD Million) and CAGR, 2023 -2036 F
- By Fuel Type
- North America Gas Engine Market Segmentation Analysis (2023 -2036
- By Power Output
- Up to 100 kW, Market Value (USD Million) and CAGR, 2023 -2036 F
- 100 -300 kW, Market Value (USD Million) and CAGR, 2023 -2036 F
- 300 -500 kW, Market Value (USD Million) and CAGR, 2023 -2036 F
- More than 500 kW, Market Value (USD Million) and CAGR, 2023 -2036 F
- By Power Output
- North America Gas Engine Market Segmentation Analysis (2023-2036)
- By Application
- Power Generation, Market Value (USD Million) and CAGR, 2023-2036F
- Cogeneration, Market Value (USD Million) and CAGR, 2023-2036F
- Mechanical Drive, Market Value (USD Million) and CAGR, 2023-2036F
- Others, Market Value (USD Million) and CAGR, 2023-2036F
- By Application
- North America Gas Engine Market Segmentation Analysis (2023-2036)
- By End User
- Utilities, Market Value (USD Million) and CAGR, 2023-2036F
- Manufacturing, Market Value (USD Million) and CAGR, 2023-2036F
- Marine, Market Value (USD Million) and CAGR, 2023-2036F
- Oil & Gas, Market Value (USD Million) and CAGR, 2023-2036F
- Others, Market Value (USD Million) and CAGR, 2023-2036F
- By End User
- North America Gas Engine Market Segmentation Analysis (2023-2036)
- By Country
- US, Market Value (USD Million) and CAGR, 2023-2036F
- Canada, Market Value (USD Million) and CAGR, 2023-2036F
- By Country
- Europe Gas Engine Market Outlook
- Market Overview
- Market Revenue by Value (USD Million) and Compound Annual Growth Rate (CAGR)
- Europe Gas Engine Market Segmentation Analysis (2023 -2036
- By Fuel Type
- By Power Output
- By Application
- By End User
- Europe Gas Engine Market Segmentation Analysis (2023-2036)
- By Country
- UK, Market Value (USD Million) and CAGR, 2023-2036F
- Germany, Market Value (USD Million) and CAGR, 2023-2036F
- France, Market Value (USD Million) and CAGR, 2023-2036F
- Italy, Market Value (USD Million) and CAGR, 2023-2036F
- Spain, Market Value (USD Million) and CAGR, 2023-2036F
- Russia, Market Value (USD Million) and CAGR, 2023-2036F
- Netherlands, Market Value (USD Million) and CAGR, 2023-2036F
- Rest of Europe, Market Value (USD Million) and CAGR, 2023-2036F
- By Country
- Asia Pacific Gas Engine Market Outlook
- Market Overview
- Market Revenue by Value (USD Million) and Compound Annual Growth Rate (CAGR)
- Asia Pacific Gas Engine Market Segmentation Analysis (2023-2036)
- By Fuel Type
- By Power Output
- By Application
- By End User
- Asia Pacific Gas Engine Market Segmentation Analysis (2023-2036)
- By Country
- China, Market Value (USD Million) and CAGR, 2023-2036F
- Japan, Market Value (USD Million) and CAGR, 2023-2036F
- India, Market Value (USD Million), Volume (Units) and CAGR, 2023- 2036F
- Australia, Market Value (USD Million) and CAGR, 2023-2036F
- South Korea, Market Value (USD Million) and CAGR, 2023-2036F
- Singapore, Market Value (USD Million) and CAGR, 2023-2036F
- Rest of Asia Pacific, Market Value (USD Million) and CAGR, 2023-2036F
- By Country
- Latin America Gas Engine Market Outlook
- Market Overview
- Market Revenue by Value (USD Million) and Compound Annual Growth Rate (CAGR)
- Latin America Gas Engine Market Segmentation Analysis (2023-2036)
- By Fuel Type
- By Power Output
- By Application
- By End User
- Latin America Gas Engine Market Segmentation Analysis (2023-2036)
- By Country
- Mexico, Market Value (USD Million) and CAGR, 2023-2036F
- Argentina, Market Value (USD Million) and CAGR, 2023-2036F
- Brazil, Market Value (USD Million) and CAGR, 2023-2036F
- Rest of Latin America, Market Value (USD Million) and CAGR, 2023- 2036F
- By Country
- Middle East & Africa Gas Engine Market Outlook
- Market Overview
- Market Revenue by Value (USD Million) and Compound Annual Growth Rate (CAGR)
- Middle East & Africa Gas Engine Market Segmentation Analysis (2023-2036)
- By Fuel Type
- By Power Output
- By Application
- By End User
- Middle East & Africa Gas Engine Market Segmentation Analysis (2023-2036)
- By Country
- GCC, Market Value (USD Million) and CAGR, 2023-2036F
- Israel, Market Value (USD Million) and CAGR, 2023-2036F
- South Africa, Market Value (USD Million) and CAGR, 2023-2036F
- Egypt, Market Value (USD Million), Value (Units) and CAGR, 2023- 2036F
- Rest of Middle East & Africa, Market Value (USD Million) and CAGR, 2023-2036F
- By Country
- India Gas Engine Market Outlook
- Market Overview
- Market Revenue by Value (USD Million), Volume (Units) and Compound Annual Growth Rate (CAGR)
- India Gas Engine Market Segmentation Analysis (2023-2036)
- By Fuel Type
- By Power Output
- By Application
- By End User
- Egypt Gas Engine Market Outlook
- Market Overview
- Market Revenue by Value (USD Million), Volume (Units) and Compound Annual Growth Rate (CAGR)
- Egypt Gas Engine Market Segmentation Analysis (2023-2036)
- By Fuel Type
- By Power Output
- By Application
- By End User
- Oman Gas Engine Market Outlook
- Market Overview
- Market Revenue by Value (USD Million), Volume (Units) and Compound Annual Growth Rate (CAGR)
- Oman Gas Engine Market Segmentation Analysis (2023-2036)
- By Fuel Type
- By Power Output
- By Application
- By End User
Gas Engine Market Outlook:
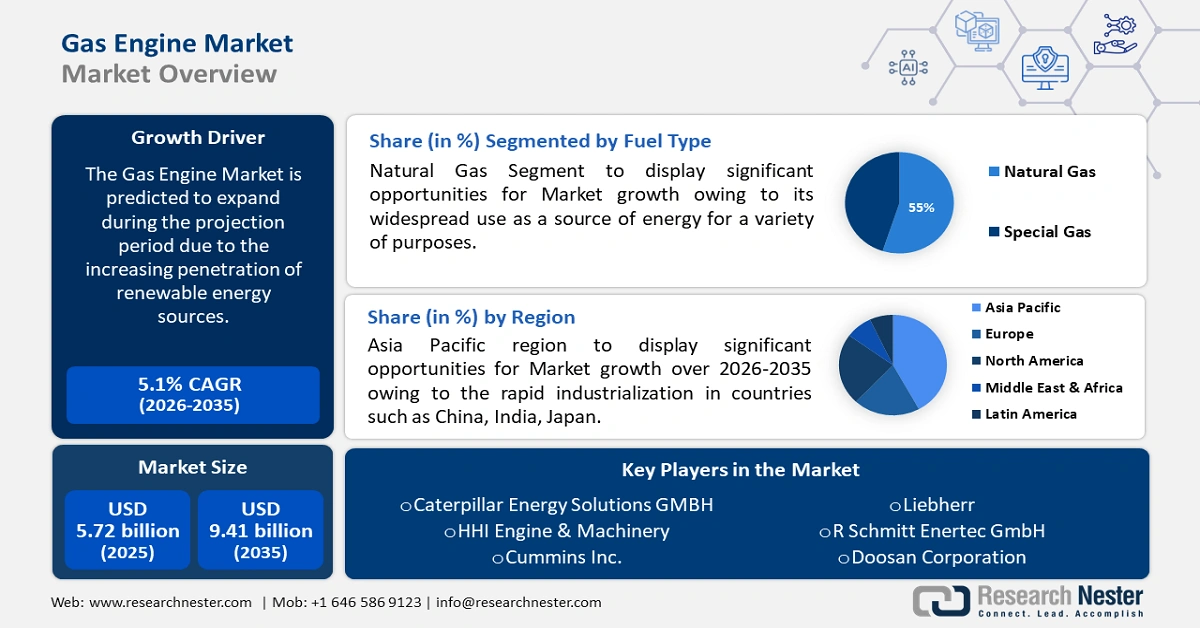
Gas Engine Market size was over USD 5.72 billion in 2025 and is projected to reach USD 9.41 billion by 2035, growing at around 5.1% CAGR during the forecast period i.e., between 2026-2035. In the year 2026, the industry size of gas engine is evaluated at USD 5.98 billion.
The gas engine market is predominantly driven by growing use of natural gas in several end use industries and the subsequent rise in its global trade. EIA estimates that non-OECD Asia to emerge as the largest importer of natural gas amounting to approximately 17 trillion cubic feet by 2050. In 2020, OECD Europe was the largest importer, followed by South Korea and Japan, and non-OECD Asia, including India and China. As per the IEO2021 Reference case, the U.S., Middle East, and Russia will continue to expand production through 2050, while the U.S. is projected to remain the largest producer globally, generating more than 43 trillion cubic feet (Tcf) in 2050 which will be a steep growth from 34 Tcf in 2020.
The U.S., the Middle East, and Russia have large proven reserves of both oil and natural gas, coupled with transportation and processing infrastructure to encourage international trade. LNG terminals and the availability of large-scale transportation vessels have created an outlet for natural gas to reach markets in Europe and Asia. Natural gas exports reached a record high of 6.90 trillion cubic feet in 2022 and the U.S. exports reached 46 countries. 44% of the U.S. natural gas exports were by pipeline, and 32% of those exports went to Canada and 68% were to Mexico.
Natural gas net exports by select countries in 2050 (trillion cubic feet)
|
Country |
Net export volume (Tcf in 2050) |
|
Russia |
14 |
|
The U.S. |
7 |
|
Middle East |
5 |
Source: EIA
Supportive policies including the Bipartisan Infrastructure Law and the Inflation Reduction Act (IRA) have rendered investments of over USD 154 billion into building automotive components. According to the U.S. Bureau of Labor Statistics (BLS), nearly 900,000 workforces manufacture large auto parts or components and assemble internal combustion engine vehicles at OEMs and Tier 1 suppliers. Supply chain employment linked to internal combustion engine vehicles comprising fuel injection systems often has a high displacement risk as more EVs are being manufactured. Of the 886,000 Tier 1 suppliers and OEM workers, around 58,000 workers cater to gasoline engines and its parts manufacturing is prone to job risks and competitiveness from the growing EV market. However, the booming global trade in natural gas and gas turbines is positively influencing the employment scenario in the gas engine market.
The global gas turbine trade was valued at USD 150 billion in 2022 and was the 21st most traded product worldwide. Gas turbine (inclusive of Gas turbine engines nes of a power > 5000 kW and Gas turbine engines nes of a power < 5000 kW) exports grew by 11.5% between 2021 and 2022, reaching from USD 135 billion to USD 150 billion and representing 0.63% of the overall global trade. The top exporters of gas turbines in 2022 were the U.S. (USD 32.5 billion), UK (USD 29.2 billion), France (USD 13.6 billion), Singapore (USD 8.48 billion), and Hong Kong (USD 7.92 billion). As per OEC, disaggregated by gas engine’s HS6 level, the most traded segments were turbo-jet engines of a thrust > 25 (USD 65.9 billion), parts of turbo-jet or turbo-propeller engines (USD 50.2 billion), parts for gas turbine engines (excl. turbo jet/prop) (USD 20.7 billion), Gas turbine engines nes of a power > 5000kW (USD 6.11 billion), and turbo-propeller engines of a power > 1000kW (USD 2.43 billion).
Key Gas Engine Market Insights Summary:
Regional Highlights:
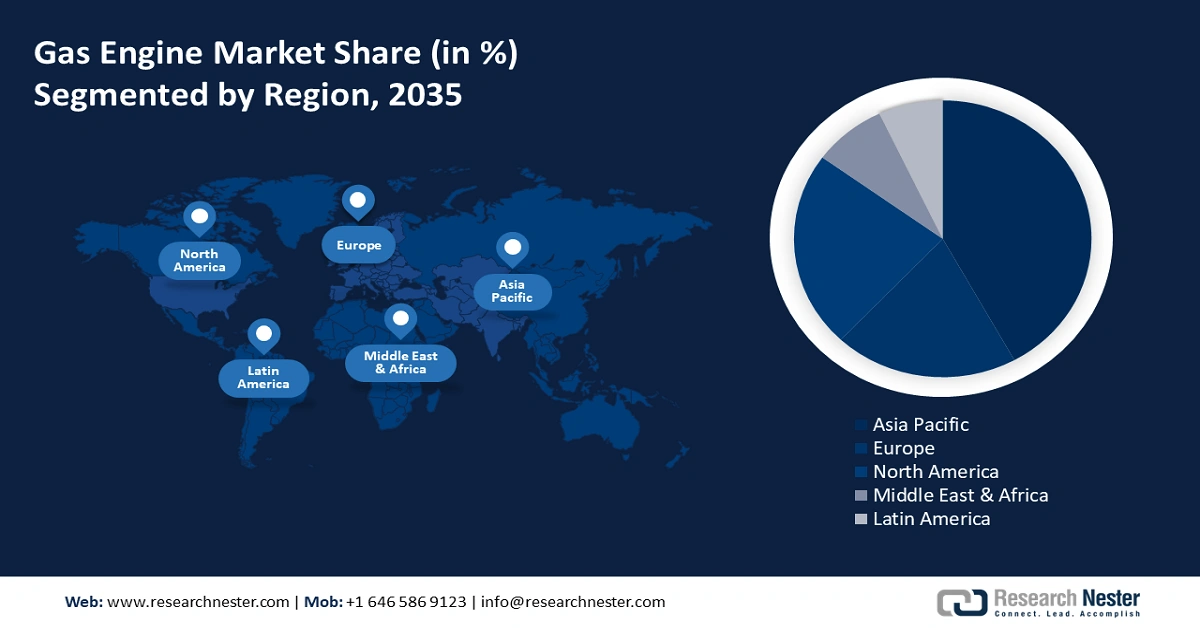
- Asia Pacific gas engine market leads with a 42% share by 2035, driven by rise in domestic natural gas production, electrification, supportive policy measures for coal- and oil-to-gas switching, and investments in gas infrastructure and manufacturing facilities.
Segment Insights:
- The >500 kw power output segment in the gas engine market is expected to experience significant growth over 2026-2035, driven by rising adoption of high-capacity gas engines for industrial and utility-scale electricity generation.
- The >500 kW power output segment in the gas engine market is projected to experience significant growth over 2026-2035, driven by rising adoption of high-capacity gas engines for industrial and utility-scale electricity generation.
Key Growth Trends:
- Rising focus on environmental sustainability
- Growing demand for distributed power generation
Major Challenges:
- Rising focus on environmental sustainability
- Growing demand for distributed power generation
Key Players: Caterpillar Energy Solutions GMBH, HHI Engine & Machinery, Cummins Inc., Liebherr, International Society of Baudouin Motors, R Schmitt Enertec GmbH, Kawasaki Heavy Industries Ltd., Doosan Corporation, Mitsubishi Heavy Industries Ltd., Deutz AZ, INNIO, Guascor Energy, Power Solutions International, Inc. (PSI), Generac Holdings Inc.
Global Gas Engine Market Forecast and Regional Outlook:
Market Size & Growth Projections:
- 2025 Market Size: USD 5.72 billion
- 2026 Market Size: USD 5.98 billion
- Projected Market Size: USD 9.41 billion by 2035
- Growth Forecasts: 5.1% CAGR (2026-2035)
Key Regional Dynamics:
- Largest Region: Asia Pacific (42% Share by 2035)
- Fastest Growing Region: Asia Pacific
- Dominating Countries: United States, China, Germany, Japan, India
- Emerging Countries: China, India, Japan, South Korea, Indonesia
Last updated on : 9 September, 2025
Gas Engine Market Growth Drivers and Challenges:
Growth Drivers:
-
Rising focus on environmental sustainability: The transportation industry plays a pivotal role in supporting the best chance of achieving the Paris Agreement’s mission to limit GHG and global warming to below 2 °C with a transformation in road transport by the end of 2050. ICCT’s observations show that efforts in line with reducing global warming by 1.5 °C correspond to minimizing emissions from fuel and electricity production and combustion for transport by a minimum of 80% as compared to today’s levels by 2050, particularly passenger cars. PHEV life-cycle GHG emissions are determined by EV versus gas engine (combustion engine) in real-world drive share or usage. This varies significantly among regions. The medium-size PHEV life-cycle GHG emissions when compared to gasoline cars is roughly 42%–46% lower in the U.S., 6%–12% lower in China, and 25%–27% lower in Europe.
-
Growing demand for distributed power generation: Gas engines are well-suited for decentralized or distributed power generation systems and are well-suited for combined heat and power (CHP) applications. The distributed generation capability makes gas engines appealing for industries, commercial buildings, and residential applications seeking reliable and efficient power solutions. Argonne National Laboratory has an active project focusing on enhancing performance and minimizing emissions of natural gas-fired stationary reciprocating engines by leveraging distributed generation with power outputs range 0.5 to 20 megawatts.
Challenge
-
Threat of substitute: The increasing adoption of electric vehicles poses a key competition for the gas engine market. The rising popularity and adoption of renewable EV alternatives that are cost-effective and sustainable is a key market challenge. Furthermore, volatile gas prices are nudging customers to opt for automobiles that re fully electric or hydrogen-fuel cell based.
Gas Engine Market Size and Forecast:
| Report Attribute | Details |
|---|---|
|
Base Year |
2025 |
|
Forecast Period |
2026-2035 |
|
CAGR |
5.1% |
|
Base Year Market Size (2025) |
USD 5.72 billion |
|
Forecast Year Market Size (2035) |
USD 9.41 billion |
|
Regional Scope |
|
Gas Engine Market Segmentation:
Fuel Type Segment Analysis
The natural gas segment in the gas engine market is expected to account for a significant revenue share by 2035. The segment growth is primarily attributable to its widespread use as a source of energy across several end use industries such as power generation, heating, and transportation. According to the International Energy Agency (IEA), an intergovernmental organization in France, the natural consumption in 2022 was 4,084 billion cubic meters (bcm) in 2022 and is expected to reach 4,242 billion cubic meters (bcm) by the end of 2025.
Power Output Segment Analysis
The more than 500 kW segment in the gas engine market is expected to record significant growth rate during the forthcoming years. Gas engines with a power output of more than 500 kW are commonly used as they offer the necessary power capacity, efficiency, flexibility, and reliability for industrial, utility-scale, and large-scale applications where significant amounts of electricity and heat are required.
Our in-depth analysis of the global market includes the following segments:
|
Fuel Type |
|
|
Power Output |
|
|
Application |
|
|
End User |
|

Vishnu Nair
Head - Global Business DevelopmentCustomize this report to your requirements — connect with our consultant for personalized insights and options.
Gas Engine Market Regional Analysis:
APAC Market Insights
The Asia Pacific gas engine market is projected to hold largest revenue share of 42% by the end of 2035. The net gas import in the region showcased a 291% surge in the last two decades, with a net gas import of 24.3% in 2022, finds EIA. The domestic natural gas production has also increased at a rate of 135% in the last 20 years, accounting for a global production share of 16% in 2022, while the total share of gas generated locally stood at 76.1%. Rise in domestic production, electrification, policy measures supporting coal- and oil-to-gas switching, and investments in building gas infrastructure, comprising regasification capacity, and the expansion of distribution and transmission, are among the main drivers.
Gas turbine import trade value in China was USD 9.9 billion in 2022, marking its spot as the top five importers. China and its People’s Liberation Army Air Force (PLAAF) are investing in advancing capabilities to penetrate the aerospace with widespread gas engine manufacturing facilities. The PLAAF aims to operate modern aircraft, comprising the J-31, J-10, and J-20. Beijing has embarked on an indigenization effort to boost in-house aero-derivative gas turbine production to offset foreign dependencies for key capabilities.
North America Market Insights
North America gas engine market is slated to grow at substantial rate through 2035. The expansion is driven by well-established and extensive energy infrastructure, including natural gas pipelines, storage facilities, and distribution networks. The region has abundant natural gas reserves and a long history of gas production and utilization. This infrastructure provides a reliable and readily available supply of natural gas, which is a common fuel for gas engines.
The U.S. is a key player in the generation of aerospace and automobile subsector. The capacity utilization of manufacturing aerospace and transportation equipment reached 60% in November 2024, as per Fred Economic Data. In 2023, the country consumed 32.50 Tcf of natural gas, which is equivalent to 33.61 quadrillion British thermal units’ quads and 36% of the total U.S. energy consumption. 4% or 1.27 Tcf was consumed for transportation, including gas engines. Approximately most of the natural gas consumption in transportation is by private vehicle fleets and government as compressed and liquefied natural gas.
Gas Engine Market Players:
- Caterpillar Energy Solutions GMBH
- Company Overview
- Business Strategy
- Key Product Offerings
- Financial Performance
- Key Performance Indicators
- Risk Analysis
- Recent Development
- Regional Presence
- SWOT Analysis
- HHI Engine & Machinery
- Cummins Inc.
- Liebherr
- International Society of Baudouin Motors
- R Schmitt Enertec GmbH
- Kawasaki Heavy Industries Ltd.
- Doosan Corporation
- Mitsubishi Heavy Industries Ltd.
- Deutz AZ
- INNIO
- Guascor Energy
- Power Solutions International, Inc. (PSI)
- Generac Holdings Inc.
The gas engine market integrating all internal combustion engine vehicle components, ranging from gas tanks, turbines, to fuel injectors is dominated by market giants like Cummins, Inc. and Mitsubishi Heavy Industries Ltd. To gain a competitive edge other companies are seeking strategic initiatives such as new product launches, geographical expansions, and technological innovation. Some of the key players in the gas engine market include:
Recent Developments
- In September 2024, Cummins initiated the production of the X15N natural gas engine. The X15N is certified to meet 2024 CARB and U.S. EPA regulations. The X15N leverages Cummins’ HELM strategy to ensure its X-series becomes a global engine platform that will comply with natural gas, hydrogen, and diesel.
- In August 2024, Raywin Power Train Technology introduced its 424 Series natural gas range of its flagship engines series platform. This signifies the company’s efforts to positively contribute to decarbonization with its environment-friendly engines.
- In February 2023, Cummins unveiled the X10 engine with an anticipated launch in North America in 2026. Cummins aims to cater to medium and heavy-duty applications. Furthermore, the company is awaiting the launch of X15, which will serve transit, vocational, pickup, and delivery operations for regional haul customers.
- Report ID: 3680
- Published Date: Sep 09, 2025
- Report Format: PDF, PPT
- Explore a preview of key market trends and insights
- Review sample data tables and segment breakdowns
- Experience the quality of our visual data representations
- Evaluate our report structure and research methodology
- Get a glimpse of competitive landscape analysis
- Understand how regional forecasts are presented
- Assess the depth of company profiling and benchmarking
- Preview how actionable insights can support your strategy
Explore real data and analysis
Frequently Asked Questions (FAQ)
Gas Engine Market Report Scope
Free Sample includes current and historical market size, growth trends, regional charts & tables, company profiles, segment-wise forecasts, and more.
Connect with our Expert


Copyright @ 2026 Research Nester. All Rights Reserved.
