Foundry Robots Market Outlook:
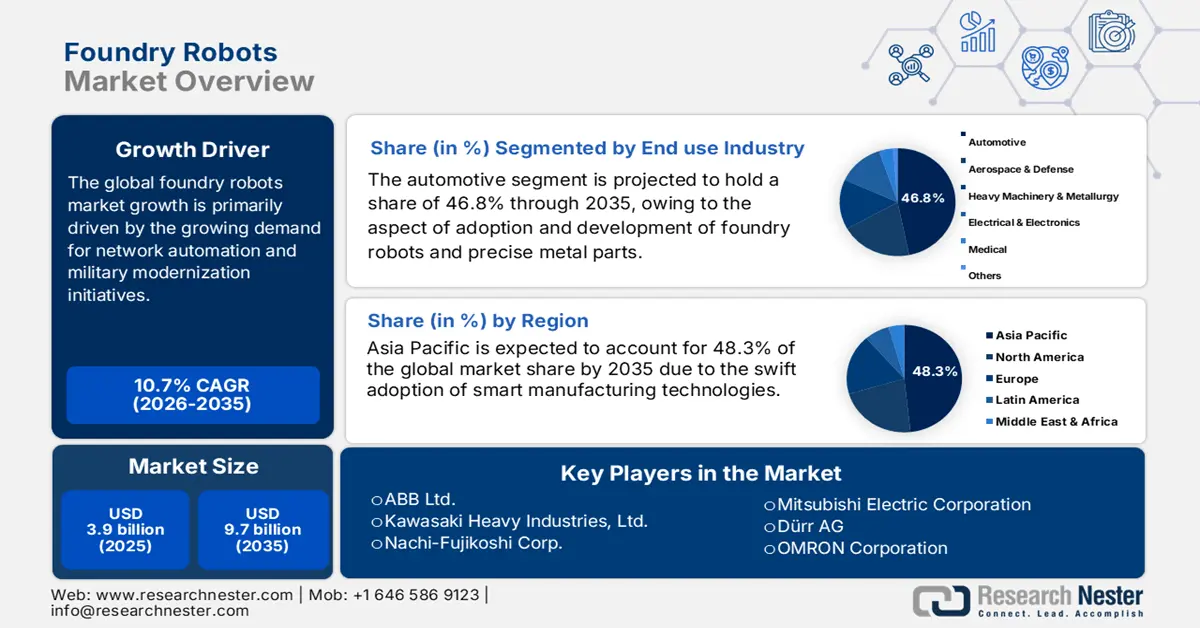
Foundry Robots Market size was over USD 3.9 billion in 2025 and is estimated to reach USD 9.7 billion by the end of 2035, expanding at a CAGR of 10.7% during the forecast timeline, i.e., 2026-2035. In 2026, the industry size of foundry robots is evaluated at USD 4.3 billion.
The overall sales of the market depend on the stable and consistent supply of raw materials as well as components. Mostly, the major upstream materials, including steel and aluminum, are traded heavily between Asia, Europe, and North America. According to an article published by the IEA Organization in July 2023, there has been a continuous growth of aluminium between 2020 and 2022 at over 3%. In addition, the worldwide aluminium rates are more than 95% for manufacturing scrap and almost 75% for end-of-life scrap. Meanwhile, foundry robots are essential for material handling and casting, depending on precision parts, including programmable logic controllers (PLCs) and high-temperature-resistant gearings.
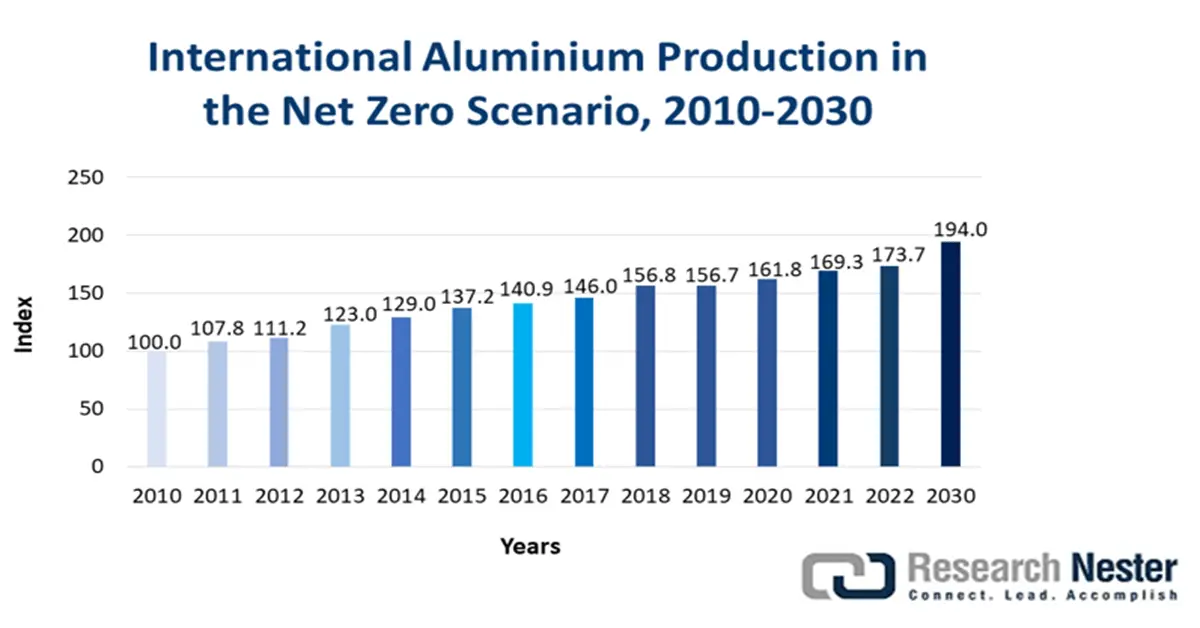
Source: IEA Organization
Furthermore, as per an article published by the IFR Organization in April 2024, manufacturing organizations in the U.S. have readily invested in automation, resulting in a rise of industrial robots by 12% and successfully reaching 44,303 units as of 2023. Besides, the expansion has been favorably reinforced by the surging demand domestically and limitations in local manufacturing capacity. The interconnected nature of the global supply chains is highlighted by a convergence of the factors exhibited in the U.S. Meanwhile, assembly lines are readily being clustered near machinery and automotive centers, which is yet another key characteristic driver for the foundry robots market. Additionally, robotics in metal casting facilities and technology upgradation are projected to boost the sales of cutting-edge foundry robots, thus suitable for market growth.
Historical Period of Yearly Industrial Robot Installations in the U.S.
|
Years |
Unit |
|
2013 |
24 |
|
2014 |
26 |
|
2015 |
28 |
|
2016 |
31 |
|
2017 |
33 |
|
2018 |
40 |
|
2019 |
33 |
|
2020 |
31 |
|
2021 |
36 |
|
2022 |
40 |
|
2023 |
44 |
Source: IFR Organization