Fertility Test Market Outlook:
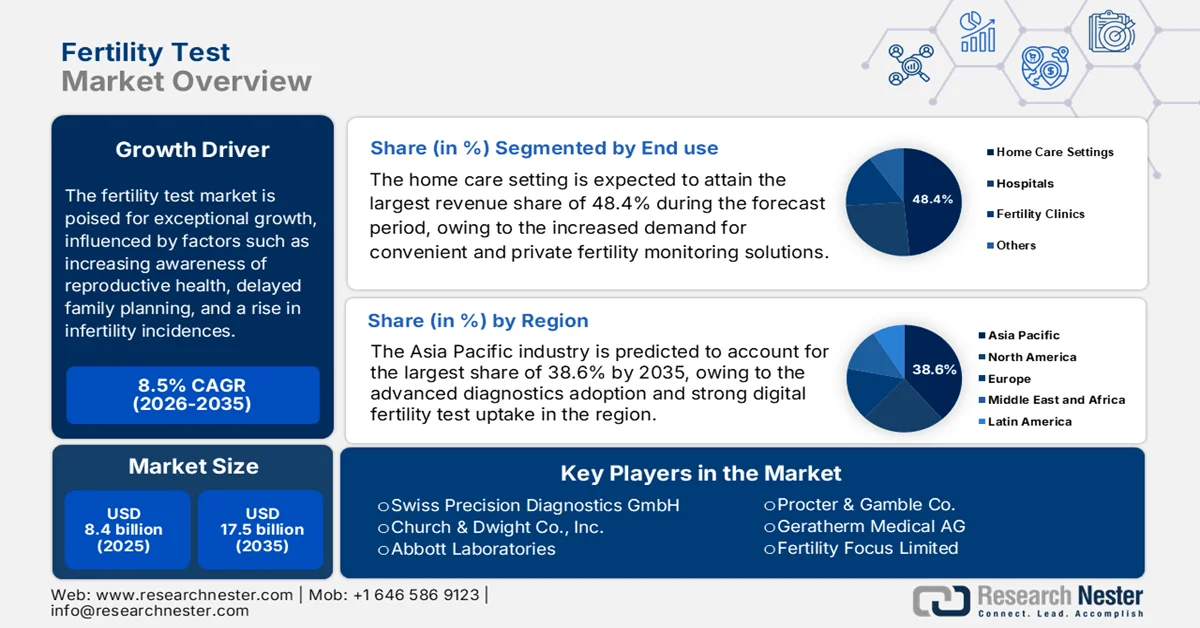
Fertility Test Market size was valued at USD 8.4 billion in 2025 and is projected to reach USD 17.5 billion by the end of 2035, rising at a CAGR of 8.5% during the forecast period, i.e., 2026-2035. In 2026, the industry size of fertility test is estimated at USD 9.1 billion.
The market is poised for exceptional growth, influenced by factors such as increasing awareness of reproductive health, delayed family planning, and a rise in infertility incidences, which efficiently drive demand for both at-home and clinical diagnostic solutions. According to the official statistics reported by the World Health Organization in November 2025, infertility affects around one in six people of reproductive age across the globe, wherein the causes range from hormonal and structural disorders in both men and women to lifestyle and environmental factors. It also mentioned that access to fertility care, such as diagnosis and assisted reproductive technologies, is limited, particularly in low- and middle-income countries. In this context, WHO emphasizes integrating fertility care into national health policies, promoting prevention, early diagnosis, and hence increasing the growth potential of the fertility test sector.
Furthermore, as per the reports published by the Washington State Health Care Authority (WSHCA), historical Medicaid enrollment data from 2020 to 2022 revealed highly detailed demographic insights, which are highly essential for assessing fertility benefit impacts. For example, female enrollees aged 18 to 24 increased from approximately 1.24-million-member months in 2020 to 1.48 million in 2022, whereas males in the same age group rose from around 940,000 to over 1.21-million-member months; it also mentioned the projections for 2024 and 2027. Hence, the study provides forecasting of fertility test demand and cost impact by identifying key demographic trends within Medicaid populations, underscoring the importance of proper fertility diagnostics and services in the evolving market landscape.
Washington State Medicaid Enrollment for Fertility Benefits: Historical and Projected Member Months by Gender and Age Band (2021-2027) - Official Government Data
|
Gender |
Age Band |
2021 |
2022 |
2024 (Projected) |
2027 (Projected) |
|
F |
Under Age 18 |
4,850,790 |
4,949,992 |
4,266,973 |
4,394,256 |
|
F |
Ages 18 to 24 |
1,385,450 |
1,475,827 |
1,272,013 |
1,309,974 |
|
F |
Ages 25 to 29 |
1,049,296 |
1,122,341 |
966,881 |
995,783 |
|
F |
Ages 30 to 34 |
986,408 |
1,088,165 |
937,656 |
965,662 |
|
F |
Ages 35 to 39 |
809,068 |
883,799 |
761,607 |
784,350 |
|
F |
Ages 40 to 44 |
634,544 |
712,669 |
614,333 |
632,658 |
|
F |
Ages 45 to 49 |
494,497 |
536,465 |
462,528 |
476,316 |
|
F |
Ages 50 to 54 |
497,137 |
533,431 |
459,969 |
473,675 |
|
F |
Ages 55 and over |
1,702,696 |
1,819,254 |
1,568,326 |
1,615,098 |
|
M |
Under Age 18 |
5,095,944 |
5,197,074 |
4,479,691 |
4,613,346 |
|
M |
Ages 18 to 24 |
1,099,155 |
1,214,741 |
1,047,461 |
1,078,672 |
|
M |
Ages 25 to 29 |
757,977 |
815,873 |
703,418 |
724,389 |
|
M |
Ages 30 to 34 |
754,147 |
844,421 |
728,079 |
749,780 |
|
M |
Ages 35 to 39 |
648,968 |
716,024 |
617,509 |
635,900 |
|
M |
Ages 40 to 44 |
543,443 |
612,970 |
528,753 |
544,489 |
|
M |
Ages 45 to 49 |
435,029 |
476,056 |
410,630 |
422,853 |
|
M |
Ages 50 to 54 |
472,713 |
500,836 |
431,963 |
444,824 |
|
M |
Ages 55 and over |
1,321,609 |
1,429,904 |
1,232,934 |
1,269,679 |
|
Total |
|
23,538,871 |
24,929,842 |
21,490,722 |
22,131,704 |
Source: Washington State Health Care Authority (WSHCA)