Electric Vehicle Charging Infrastructure Market Regional Analysis:
APAC Market Insights
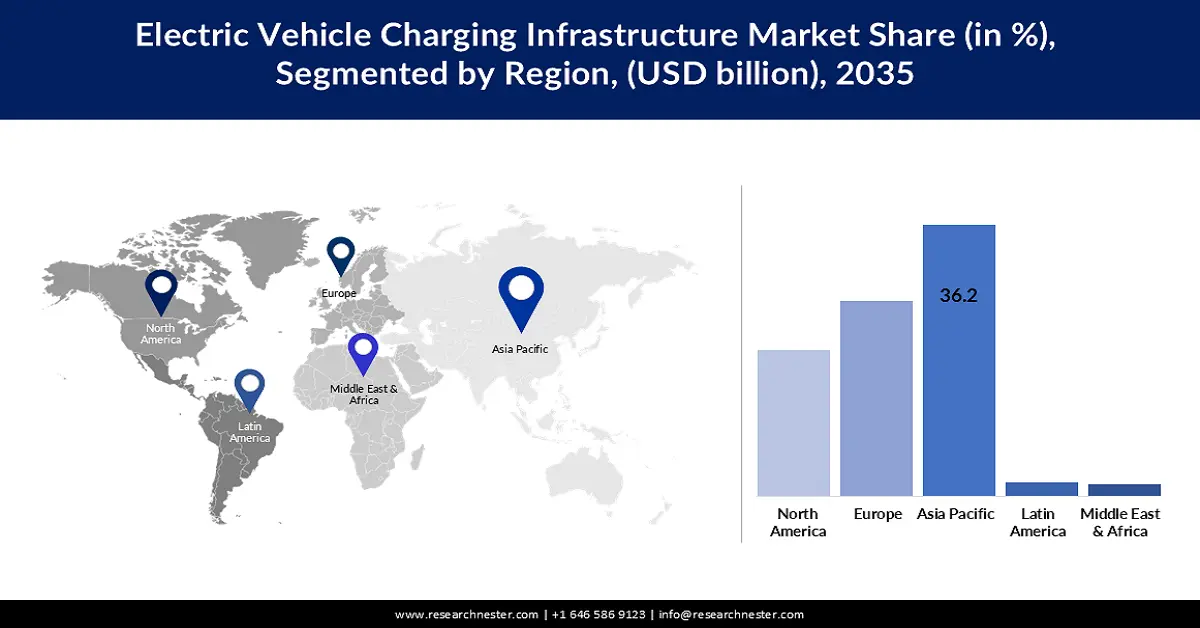
Asia Pacific industry is expected to hold largest revenue share of 36.2% by 2035. Several key factors are driving this growth, including rapid urbanization, increasing disposable income, and supportive government policies promoting EV adoption. Additionally, the presence of major automotive manufacturers in the region, coupled with their focus on developing affordable EV models contributes to the market's growth in this region.
China leads the APAC EV charging infrastructure market and is expected to continue its dominance until 2035. The prime factors driving EV charging infrastructure in China include government support through subsidies, incentives, and benign policies for spreading EV adoption and developing a robust charging network. For instance, in June 2023, the Chinese government extended the exemption on new energy vehicle taxes to 2027, continuing to drive EV sales and indirectly charging infrastructure demand.
India’s EV charging infrastructure industry is expected to rise at an exponential CAGR during the forecast period. One of the huge catalysts for growth in India's EV charging infrastructure market has been the ambitious target set by the government, which is to achieve 30% EV sales penetration by the year 2030. Initiatives launched by the government to achieve this target include the Faster Adoption and Manufacturing of Hybrid and Electric Vehicles scheme, which provides financial incentives for both purchases of EVs and the setting up of charging infrastructure. Further, partnerships between public and private sectors have been quite instrumental in expanding the network of charging outlets and thereby accelerating the adoption of EVs in India.
North America Market Insights
North American EV charging infrastructure market is likely to expand at a massive growth rate during the projection period. Some factors driving growth include the rising adoption of EVs, favorable government policies such as tax incentives and subsidies, and technological advancements in EV charging. Furthermore, increasing funds by the public and private sectors for the development of charging infrastructure is expected to boost market growth going ahead.
The U.S. is anticipated to lead the EV charging infrastructure market with lucrative growth through 2035. One major development that reinforces growth is the Bipartisan Infrastructure Law passed in November 2021, which dedicated USD 7.5 billion to establishing a national network of 500,000 EV chargers. This investment is likely to substantially improve access to and availability of the charging infrastructure, thereby further stimulating EV adoption and market growth.
Canada is likely to offer ample expansion opportunities for players in the EV charging infrastructure market during the forecast period. In February 2022, the Canadian government announced an investment of USD 547.5 million to facilitate the installation of 50,000 EV chargers across the country. This resulted in added convenience to charging electric vehicles while supporting the expansion of the market.