Global Commercial Vehicles Market
- An outline of the Global Commercial Vehicles Market
- Market Definition
- Market Segmentation
- Solution Overview
- Assumptions and Abbreviations
- Research Methodology & Approach
- Primary Research
- Secondary Research
- Data Triangulation
- SPSS Methodology
- Executive Summary
- Growth Drivers
- Major Roadblocks
- Opportunities
- Market Trends
- Government Regulations: How they would aid business?
- Recent Technological Advancements
- Root Cause Analysis (RCA)
- Growth Outlook
- Risk Analysis
- Pricing Benchmarking
- SWOT
- Supply Chain
- Sensor Technology Adoption Scenario
- Key Sensor Technology Suppliers
- Regional Demand
- Key Application
- High Performance Window Analysis
- Future Applications & Outlook Analysis
- Role of High-speed Communication & its Applications
- Role of 5G Millimeter Wave Technology
- Challenges in Implementing High-Speed Communications
- Challenges in Implementing 5G Millimeter Wave Technology
- Currents Development & Future Outlook
- Key Developments
- Competitive Landscape: Key Players
- Competitive Model
- Market Share of Major Companies Profiled, 2023
- Business Profile of Key Enterprise
- AB Volvo
- Alexander Dennis Limited
- Ashok Leyland Limited.
- Blue Bird Corporation.
- BYD Motors
- Collins Bus Corporation
- Daimler Truck Holding AG
- Deccan Auto Limited
- Eicher Motors Limited
- Ford Motor Company
- Hyundai Motor Company
- ISUZU MOTORS
- Iveco Group NV.
- JBM Motor Limited
- Mahindra and Mahindra.
- PACCAR Inc.
- Tata Motors Limited.
- TEMSA
- The Lion Electric Company
- TRATON SE
- VDL Van Hool.
- Yutong Group
- Global Commercial Vehicles Market Outlook
- Market Overview
- Market Revenue by Value (USD Billion), Volume(Thousand Units) and Compound Annual Growth Rate (CAGR)
- Global Commercial Vehicles Market Segmentation Analysis (2014-2037)
- By Vehicle Type
- Trucks, Market Value (USD Billion), Volume(Thousand Units) and CAGR, 2014-2037F
- Light-Duty Trucks, Market Value (USD Billion), Volume(Thousand Units) and CAGR, 2014-2037F
- Medium-Duty Trucks, Market Value (USD Billion), Volume(Thousand Units) and CAGR, 2014-2037F
- Heavy-Duty Trucks, Market Value (USD Billion), Volume(Thousand Units) and CAGR, 2014-2037F
- Buses, Market Value (USD Billion), Volume (Thousand Units) and CAGR, 2014-2037F
- Transit Buses, Market Value (USD Billion), Volume(Thousand Units) and CAGR, 2014-2037F
- School Buses, Market Value (USD Billion), Volume(Thousand Units) and CAGR, 2014-2037F
- Coach Buses, Market Value (USD Billion), Volume(Thousand Units) and CAGR, 2014-2037F
- By Propulsion Type
- ICE, Market Value (USD Billion) and CAGR, 2014-2037F
- Electric, Market Value (USD Billion) and CAGR, 2014-2037F
- By Application
- Freight & Logistics, Market Value (USD Billion) and CAGR, 2014-2037F
- Construction & Mining, Market Value (USD Billion) and CAGR, 2014-2037F
- Public Transportation, Market Value (USD Billion) and CAGR, 2014-2037F
- Emergency & Utility Services, Market Value (USD Billion) and CAGR, 2014-2037F
- Tourism, Market Value (USD Billion) and CAGR, 2014-2037F
- Others (Industrial & Agriculture, etc.), Market Value (USD Billion) and CAGR, 2014-2037F
- By Region
- North America, Market Value (USD Billion), Volume (Thousand Units), and CAGR, 2014-2037F
- Europe Market Value (USD Billion) Volume (Thousand Units), and CAGR, 2014-2037F
- Asia Pacific Excluding Japan Market Value (USD Billion), Volume (Thousand Units), and CAGR, 2014-2037F
- Japan Market Value (USD Billion), Volume (Thousand Units), and CAGR, 2014-2037F
- Latin America Market Value (USD Billion), Volume (Thousand Units), and CAGR, 2014-2037F
- Middle East and Africa Market Value (USD Billion), Volume (Thousand Units), and CAGR, 2014-2037F
- By Vehicle Type
- Cross Analysis of Vehicle Type W.R.T. Propulsion Type (USD Billion), 2014-2037
- North America Commercial Vehicles Market Outlook
- Market Overview
- Market Revenue by Value (USD Billion), Volume (Thousand Units), and Compound Annual Growth Rate (CAGR)
- Opportunities, and Trends in the Region
- Key Players in the Region
- North America Commercial Vehicles Market Segmentation Analysis (2014-2037)
- By Vehicle Type
- Trucks, Market Value (USD Billion), Volume(Thousand Units) and CAGR, 2014-2037F
- Light-Duty Trucks, Market Value (USD Billion), Volume(Thousand Units) and CAGR, 2014-2037F
- Medium-Duty Trucks, Market Value (USD Billion), Volume(Thousand Units) and CAGR, 2014-2037F
- Heavy-Duty Trucks, Market Value (USD Billion), Volume(Thousand Units) and CAGR, 2014-2037F
- Buses, Market Value (USD Billion), Volume (Thousand Units) and CAGR, 2014-2037F
- Transit Buses, Market Value (USD Billion), Volume(Thousand Units) and CAGR, 2014-2037F
- School Buses, Market Value (USD Billion), Volume(Thousand Units) and CAGR, 2014-2037F
- Coach Buses, Market Value (USD Billion), Volume(Thousand Units) and CAGR, 2014-2037F
- By Propulsion Type
- ICE, Market Value (USD Billion) and CAGR, 2014-2037F
- Electric, Market Value (USD Billion) and CAGR, 2014-2037F
- By Application
- Freight & Logistics, Market Value (USD Billion) and CAGR, 2014-2037F
- Construction & Mining, Market Value (USD Billion) and CAGR, 2014-2037F
- Public Transportation, Market Value (USD Billion) and CAGR, 2014-2037F
- Emergency & Utility Services, Market Value (USD Billion) and CAGR, 2014-2037F
- Tourism, Market Value (USD Billion) and CAGR, 2014-2037F
- Others (Industrial & Agriculture, etc.), Market Value (USD Billion) and CAGR, 2014-2037F
- By Country
- U.S., Market Value (USD Billion), Volume(Thousand Units) and CAGR, 2014-2037F
- Canada Market Value (USD Billion), Volume(Thousand Units) and CAGR, 2014-2037F
- By Vehicle Type
- Market Overview
- Cross Analysis of Vehicle Type W.R.T. Propulsion Type (USD Billion), 2014-2037
- Europe Commercial Vehicles Market Outlook
- Market Overview
- Market Revenue by Value (USD Billion), Volume (Thousand Units), and Compound Annual Growth Rate (CAGR)
- Opportunities, and Trends in the Region
- Key Players in the Region
- Europe Commercial Vehicles Market Segmentation Analysis (2014-2037)
- By Vehicle Type
- Trucks, Market Value (USD Billion), Volume(Thousand Units) and CAGR, 2014-2037F
- Light-Duty Trucks, Market Value (USD Billion), Volume(Thousand Units) and CAGR, 2014-2037F
- Medium-Duty Trucks, Market Value (USD Billion), Volume(Thousand Units) and CAGR, 2014-2037F
- Heavy-Duty Trucks, Market Value (USD Billion), Volume(Thousand Units) and CAGR, 2014-2037F
- Buses, Market Value (USD Billion), Volume (Thousand Units) and CAGR, 2014-2037F
- Transit Buses, Market Value (USD Billion), Volume(Thousand Units) and CAGR, 2014-2037F
- School Buses, Market Value (USD Billion), Volume(Thousand Units) and CAGR, 2014-2037F
- Coach Buses, Market Value (USD Billion), Volume(Thousand Units) and CAGR, 2014-2037F
- By Propulsion Type
- ICE, Market Value (USD Billion) and CAGR, 2014-2037F
- Electric, Market Value (USD Billion) and CAGR, 2014-2037F
- By Application
- Freight & Logistics, Market Value (USD Billion) and CAGR, 2014-2037F
- Construction & Mining, Market Value (USD Billion) and CAGR, 2014-2037F
- Public Transportation, Market Value (USD Billion) and CAGR, 2014-2037F
- Emergency & Utility Services, Market Value (USD Billion) and CAGR, 2014-2037F
- Tourism, Market Value (USD Billion) and CAGR, 2014-2037F
- Others (Industrial & Agriculture, etc.), Market Value (USD Billion) and CAGR, 2014-2037F
- By Country
- UK, Market Value (USD Billion), Volume(Thousand Units) and CAGR, 2014-2037F
- Germany, Market Value (USD Billion), Volume(Thousand Units) and CAGR, 2014-2037F
- France, Market Value (USD Billion), Volume(Thousand Units) and CAGR, 2014-2037F
- Italy, Market Value (USD Billion), Volume(Thousand Units) and CAGR, 2014-2037F
- Spain, Market Value (USD Billion), Volume(Thousand Units) and CAGR, 2014-2037F
- BENELUX, Market Value (USD Billion), Volume(Thousand Units) and CAGR, 2014-2037F
- Poland, Market Value (USD Billion), Volume(Thousand Units) and CAGR, 2014-2037F
- Russia, Market Value (USD Billion), Volume(Thousand Units), and CAGR, 2014-2037F
- Rest of Europe, Market Value (USD Billion), Volume(Thousand Units) and CAGR, 2014-2037F
- By Vehicle Type
- Market Overview
- Cross Analysis of Vehicle Type W.R.T. Propulsion Type (USD Billion), 2014-2037
- Asia Pacific Excluding Japan Commercial Vehicles Market Outlook
- Market Overview
- Market Revenue by Value (USD Billion) , Volume (Thousand Units), and Compound Annual Growth Rate (CAGR)
- Opportunities, and Trends in the Region
- Key Players in the Region
- Asia Pacific Excluding Japan Commercial Vehicles Market Segmentation Analysis (2014-2037)
- By Vehicle Type
- Trucks, Market Value (USD Billion), Volume(Thousand Units) and CAGR, 2014-2037F
- Light-Duty Trucks, Market Value (USD Billion), Volume(Thousand Units) and CAGR, 2014-2037F
- Medium-Duty Trucks, Market Value (USD Billion), Volume(Thousand Units) and CAGR, 2014-2037F
- Heavy-Duty Trucks, Market Value (USD Billion), Volume(Thousand Units) and CAGR, 2014-2037F
- Buses, Market Value (USD Billion), Volume (Thousand Units) and CAGR, 2014-2037F
- Transit Buses, Market Value (USD Billion), Volume(Thousand Units) and CAGR, 2014-2037F
- School Buses, Market Value (USD Billion), Volume(Thousand Units) and CAGR, 2014-2037F
- Coach Buses, Market Value (USD Billion), Volume(Thousand Units) and CAGR, 2014-2037F
- By Propulsion Type
- ICE, Market Value (USD Billion) and CAGR, 2014-2037F
- Electric, Market Value (USD Billion) and CAGR, 2014-2037F
- By Application
- Freight & Logistics, Market Value (USD Billion) and CAGR, 2014-2037F
- Construction & Mining, Market Value (USD Billion) and CAGR, 2014-2037F
- Public Transportation, Market Value (USD Billion) and CAGR, 2014-2037F
- Emergency & Utility Services, Market Value (USD Billion) and CAGR, 2014-2037F
- Tourism, Market Value (USD Billion) and CAGR, 2014-2037F
- Others (Industrial & Agriculture, etc.), Market Value (USD Billion) and CAGR, 2014-2037F
- By Country
- China, Market Value (USD Billion), Volume(Thousand Units) and CAGR, 2014-2037F
- India, Market Value (USD Billion), Volume(Thousand Units) and CAGR, 2014-2037F
- Indonesia, Market Value (USD Billion), Volume(Thousand Units) and CAGR, 2014-2037F
- South Korea, Market Value (USD Billion), Volume(Thousand Units) and CAGR, 2014-2037F
- Malaysia, Market Value (USD Billion), Volume(Thousand Units) and CAGR, 2014-2037F
- Australia, Market Value (USD Billion), Volume(Thousand Units) and CAGR, 2014-2037F
- Singapore, Market Value (USD Billion), Volume(Thousand Units) and CAGR, 2014-2037F
- Vietnam, Market Value (USD Billion), Volume(Thousand Units) and CAGR, 2014-2037F
- Thailand, Market Value (USD Billion), Volume(Thousand Units) and CAGR, 2014-2037F
- New Zealand, Market Value (USD Billion), Volume(Thousand Units) and CAGR, 2014-2037F
- Rest of Asia Pacific excluding Japan, Market Value (USD Billion), Volume(Thousand Units) and CAGR, 2014-2037F
- By Vehicle Type
- Market Overview
- Cross Analysis of Vehicle Type W.R.T. Propulsion Type (USD Billion), 2014-2037
- Japan Commercial Vehicles Market Outlook
- Market Overview
- Market Revenue by Value (USD Billion), Volume (Thousand Units), and Compound Annual Growth Rate (CAGR)
- Opportunities, and Trends in the Region
- Key Players in the Region
- Japan Commercial Vehicles Market Segmentation Analysis (2014-2037)
- By Vehicle Type
- Trucks, Market Value (USD Billion), Volume(Thousand Units) and CAGR, 2014-2037F
- Light-Duty Trucks, Market Value (USD Billion), Volume(Thousand Units) and CAGR, 2014-2037F
- Medium-Duty Trucks, Market Value (USD Billion), Volume(Thousand Units) and CAGR, 2014-2037F
- Heavy-Duty Trucks, Market Value (USD Billion), Volume(Thousand Units) and CAGR, 2014-2037F
- Buses, Market Value (USD Billion), Volume (Thousand Units) and CAGR, 2014-2037F
- Transit Buses, Market Value (USD Billion), Volume(Thousand Units) and CAGR, 2014-2037F
- School Buses, Market Value (USD Billion), Volume(Thousand Units) and CAGR, 2014-2037F
- Coach Buses, Market Value (USD Billion), Volume(Thousand Units) and CAGR, 2014-2037F
- By Propulsion Type
- ICE, Market Value (USD Billion) and CAGR, 2014-2037F
- Electric, Market Value (USD Billion) and CAGR, 2014-2037F
- By Application
- Freight & Logistics, Market Value (USD Billion) and CAGR, 2014-2037F
- Construction & Mining, Market Value (USD Billion) and CAGR, 2014-2037F
- Public Transportation, Market Value (USD Billion) and CAGR, 2014-2037F
- Emergency & Utility Services, Market Value (USD Billion) and CAGR, 2014-2037F
- Tourism, Market Value (USD Billion) and CAGR, 2014-2037F
- Others (Industrial & Agriculture, etc.), Market Value (USD Billion) and CAGR, 2014-2037F
- By Vehicle Type
- Market Overview
- Cross Analysis of Vehicle Type W.R.T. Propulsion Type (USD Billion), 2014-2037
- Latin America Commercial Vehicles Market Outlook
- Market Overview
- Market Revenue by Value (USD Billion), Volume (Thousand Units), and Compound Annual Growth Rate (CAGR)
- Predictions and Trend Analysis for Commercial Vehicles
- Regional Competitors and Market Positioning
- Latin America Commercial Vehicles Market Segmentation Analysis (2014-2037)
- By Vehicle Type
- Trucks, Market Value (USD Billion), Volume(Thousand Units) and CAGR, 2014-2037F
- Light-Duty Trucks, Market Value (USD Billion), Volume(Thousand Units) and CAGR, 2014-2037F
- Medium-Duty Trucks, Market Value (USD Billion), Volume(Thousand Units) and CAGR, 2014-2037F
- Heavy-Duty Trucks, Market Value (USD Billion), Volume(Thousand Units) and CAGR, 2014-2037F
- Buses, Market Value (USD Billion), Volume (Thousand Units) and CAGR, 2014-2037F
- Transit Buses, Market Value (USD Billion), Volume(Thousand Units) and CAGR, 2014-2037F
- School Buses, Market Value (USD Billion), Volume(Thousand Units) and CAGR, 2014-2037F
- Coach Buses, Market Value (USD Billion), Volume(Thousand Units) and CAGR, 2014-2037F
- By Propulsion Type
- ICE, Market Value (USD Billion) and CAGR, 2014-2037F
- Electric, Market Value (USD Billion) and CAGR, 2014-2037F
- By Application
- Freight & Logistics, Market Value (USD Billion) and CAGR, 2014-2037F
- Construction & Mining, Market Value (USD Billion) and CAGR, 2014-2037F
- Public Transportation, Market Value (USD Billion) and CAGR, 2014-2037F
- Emergency & Utility Services, Market Value (USD Billion) and CAGR, 2014-2037F
- Tourism, Market Value (USD Billion) and CAGR, 2014-2037F
- Others (Industrial & Agriculture, etc.), Market Value (USD Billion) and CAGR, 2014-2037F
- By Country
- Brazil, Market Value (USD Billion) and CAGR, 2014-2037F
- Argentina, Market Value (USD Billion) and CAGR, 2014-2037F
- Mexico, Market Value (USD Billion) and CAGR, 2014-2037F
- Rest of Latin America, Market Value (USD Billion) and CAGR, 2014-2037F
- By Vehicle Type
- Market Overview
- Cross Analysis of Vehicle Type W.R.T. Propulsion Type (USD Billion), 2014-2037
- Middle East & Africa Commercial Vehicles Market Outlook
- Market Overview
- Market Revenue by Value (USD Billion) , Volume (Thousand Units), and Compound Annual Growth Rate (CAGR)
- Opportunities, and Trends in the Region
- Key Players in the Region
- Middle East & Africa Commercial Vehicles Market Segmentation Analysis (2014-2037)
- By Vehicle Type
- Trucks, Market Value (USD Billion), Volume(Thousand Units) and CAGR, 2014-2037F
- Light-Duty Trucks, Market Value (USD Billion), Volume(Thousand Units) and CAGR, 2014-2037F
- Medium-Duty Trucks, Market Value (USD Billion), Volume(Thousand Units) and CAGR, 2014-2037F
- Heavy-Duty Trucks, Market Value (USD Billion), Volume(Thousand Units) and CAGR, 2014-2037F
- Buses, Market Value (USD Billion), Volume (Thousand Units) and CAGR, 2014-2037F
- Transit Buses, Market Value (USD Billion), Volume(Thousand Units) and CAGR, 2014-2037F
- School Buses, Market Value (USD Billion), Volume(Thousand Units) and CAGR, 2014-2037F
- Coach Buses, Market Value (USD Billion), Volume(Thousand Units) and CAGR, 2014-2037F
- By Propulsion Type
- ICE, Market Value (USD Billion) and CAGR, 2014-2037F
- Electric, Market Value (USD Billion) and CAGR, 2014-2037F
- By Application
- Freight & Logistics, Market Value (USD Billion) and CAGR, 2014-2037F
- Construction & Mining, Market Value (USD Billion) and CAGR, 2014-2037F
- Public Transportation, Market Value (USD Billion) and CAGR, 2014-2037F
- Emergency & Utility Services, Market Value (USD Billion) and CAGR, 2014-2037F
- Tourism, Market Value (USD Billion) and CAGR, 2014-2037F
- Others (Industrial & Agriculture, etc.), Market Value (USD Billion) and CAGR, 2014-2037F
- By Country
- GCC, Market Value (USD Billion) and CAGR, 2014-2037F
- Israel, Market Value (USD Billion) and CAGR, 2014-2037F
- South Africa, Market Value (USD Billion) and CAGR, 2014-2037F
- Rest of Middle East & Africa, Market Value (USD Billion) and CAGR, 2014-2037F
- By Vehicle Type
- Market Overview
- Cross Analysis of Vehicle Type W.R.T. Propulsion Type (USD Billion), 2014-2037
- World Economic Outlook
- About Research Nester
Commercial Vehicles Market Outlook:
Commercial Vehicles Market size was over USD 1.34 trillion in 2025 and is projected to reach USD 2.31 trillion by 2035, growing at around 5.6% CAGR during the forecast period i.e., between 2026-2035. In the year 2026, the industry size of commercial vehicles is evaluated at USD 1.41 trillion.
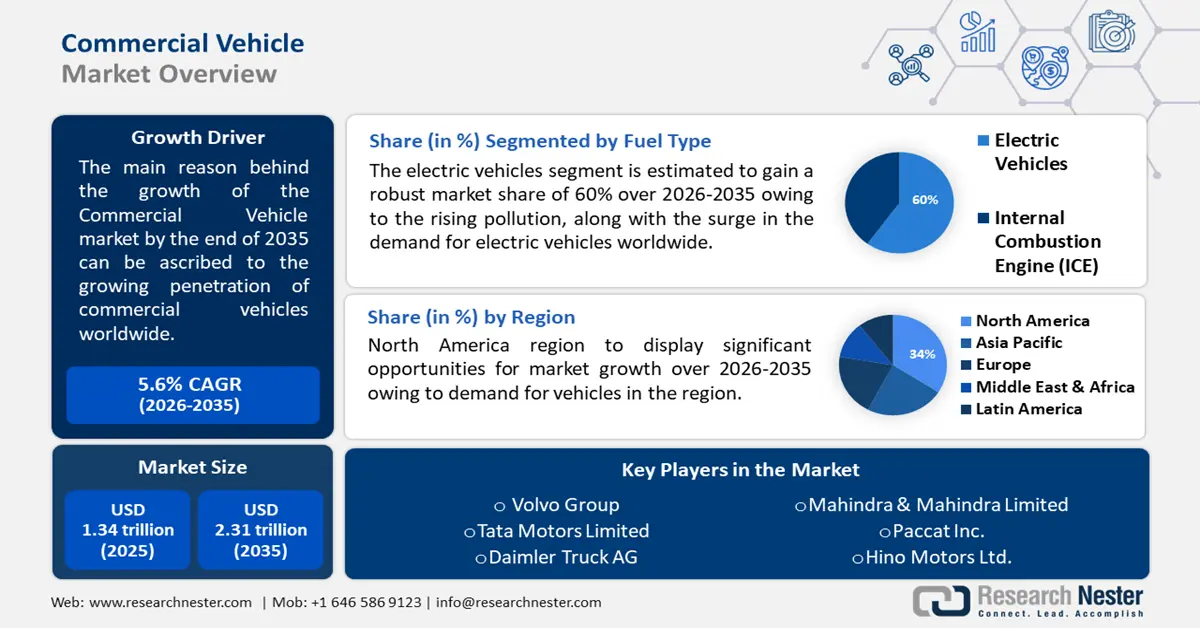
The commercial vehicles market is experiencing steady expansion primarily due to the development of electric and hydrogen-powered vehicles, as well as the increasing need for fleet renewal. The demand for green energy and reducing greenhouse gas emissions has forced manufacturers such as Volvo Trucks and Ashok Leyland to come up with new technologies in propulsion systems. In May 2024, Volvo Trucks unveiled its plans to design hydrogen-powered combustion engines to be launched in the market by the end of the decade. These innovations meet the global goals of controlling carbon emissions while at the same time meeting the increasing demand for proper logistics and public transport systems.
Strategies and policies put in place by the government to advance clean energy transitions and urban transport are driving the commercial vehicles market. In October 2024, Ashok Leyland laid out its roadmap to launch hydrogen-powered trucks in the next 18-24 months while signing agreements for 180 electric vehicles for major Indian routes. Such developments are in conformity with the general trend of the world to cut down on carbon emissions and enhance the fuel efficiency of business transport. Such strategies indicate the rising need for trucks and buses with better and environmentally friendly technologies, and hence, promising prospects for the market.
Key Commercial Vehicle Market Insights Summary:
Regional Highlights:
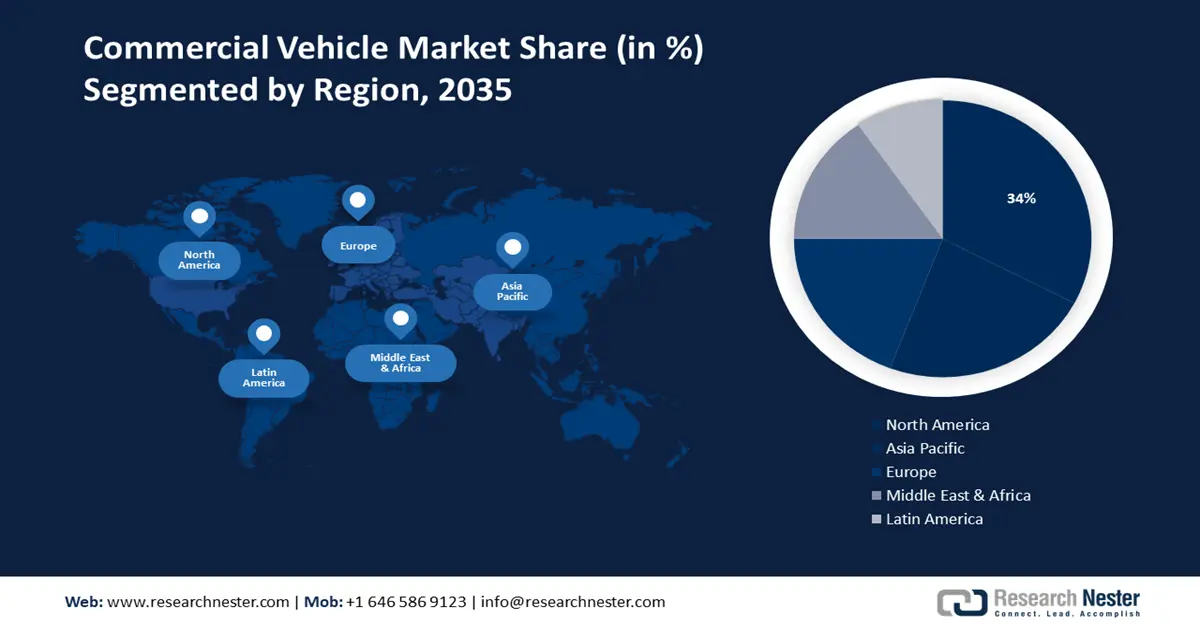
- The North America commercial vehicles market will hold around 47.7% share by 2035, attributed to increased focus on manufacturing and innovation.
- The Asia Pacific market will achieve substantial growth from 2026 to 2035, attributed to rising industrialization and infrastructure development.
Segment Insights:
- The trucks segment in the commercial vehicles market is projected to achieve an 87% share by 2035, attributed to rising demand for logistics solutions and infrastructure development.
- The ice (propulsion type) segment in the commercial vehicles market is forecasted to attain a 75% share by 2035, driven by affordability and widespread infrastructure for ICE vehicles.
Key Growth Trends:
- Shift toward zero-emission vehicles
- Technological innovations in autonomous vehicles
Major Challenges:
- Stringent emission regulations
- Infrastructure limitations for alternative propulsion
Key Players: Daimler AG, AB Volvo, Scania AB, Navistar International Corporation, PACCAR Inc., MAN SE, Isuzu Motors Limited, Hino Motors, Ltd., CNH Industrial N.V., Dongfeng Motor Corporation.
Global Commercial Vehicle Market Forecast and Regional Outlook:
Market Size & Growth Projections:
- 2025 Market Size: USD 1.34 trillion
- 2026 Market Size: USD 1.41 trillion
- Projected Market Size: USD 2.31 trillion by 2035
- Growth Forecasts: 5.6% CAGR (2026-2035)
Key Regional Dynamics:
- Largest Region: North America (47.7% Share by 2035)
- Fastest Growing Region: Asia Pacific
- Dominating Countries: China, United States, Germany, Japan, India
- Emerging Countries: China, India, Japan, Thailand, Indonesia
Last updated on : 9 September, 2025
Commercial Vehicles Market Growth Drivers and Challenges:
Growth Drivers
- Shift toward zero-emission vehicles: The goal of achieving net-zero carbon emissions by 2050 has led to the use of electric and hydrogen-powered commercial vehicles. For instance, in October 2024, Volvo Buses unveiled plans to increase its electric bus range in Europe and plans to manufacture the buses from 2025. This change is due to the government's encouragement and increasing awareness of the environmental impact that drives fleet operators to seek more environmentally friendly solutions. Also, progress in battery technology and charging infrastructure is speeding up the shift to zero-emission vehicles, which makes sustainable mobility more available for operators.
- Technological innovations in autonomous vehicles: Self-automated technologies are gradually being introduced into the commercial vehicles market. In November 2024, Caterpillar Inc. proved the fully autonomous operation of its Cat 777 off-highway truck in quarry and aggregates industries. These developments cut down on costs and enhance safety, hence giving manufacturers a competitive advantage. In addition, collaboration between technology companies and automotive companies is driving innovation to address the increasing need for high-performance and dependable autonomous vehicles in industrial settings.
- Global infrastructure development: The growing population and development of new infrastructures across the globe are contributing to the expansion of the commercial vehicles market. In August 2024, VE Commercial Vehicles Ltd. presented new generation buses at PRAWAAS 4.0 in India to meet the new transport needs. The expansion of the market is being driven by investments in public transport infrastructure and logistics networks. In addition, smart cities and the development of road networks funded by the government have led to a high demand for new-generation trucks and buses to boost the growth of the commercial vehicles market.
Challenges
- Infrastructure limitations for alternative propulsion: While there are increasing numbers of electric and hydrogen-powered cars on the roads, charging and refueling stations are still lacking. The lack of fast charging infrastructure and hydrogen refueling stations also poses challenges to the operational use of these vehicles, especially for long distance and intercity transport. In 2024, 25 percent of the planned hydrogen refueling stations across the globe were still in the pipeline, which reveals the existing difference between the demand and the available infrastructures. This challenge is further exacerbated by the fact that the construction and operation of these facilities are capital intensive thus slowing the development of other power systems.
- Stringent emission regulations: Adherence to the continuously developing global emission standards is a problem for manufacturers, especially in areas with diverse legal systems. Standards like Euro 7 and California’s Advanced Clean Truck (ACT) rules require considerable improvements in technology and thus raise production costs and complexity. According to the International Council on Clean Transportation (ICCT) study in January 2024, it is estimated that achieving the emission standards for the global market means that the manufacturers have to spend 15-20% of their annual R&D budget on compliance-related activities. Furthermore, there is no standardization of the systems across the regions, which leads to different vehicle models across the world.
Commercial Vehicles Market Size and Forecast:
| Report Attribute | Details |
|---|---|
|
Base Year |
2025 |
|
Forecast Period |
2026-2035 |
|
CAGR |
5.6% |
|
Base Year Market Size (2025) |
USD 1.34 trillion |
|
Forecast Year Market Size (2035) |
USD 2.31 trillion |
|
Regional Scope |
|
Commercial Vehicles Market Segmentation:
Vehicle Type Segment Analysis
The truck segment is set to capture over 87% commercial vehicles market share by 2035, owing to the increasing need for better logistics and Commercial vehicles. In August 2024, Volvo Trucks announced collaboration with DSV to supply 300 electric heavy-duty trucks which is among the biggest orders of electric trucks in Europe. This highlights the movement towards sustainable freight solutions to meet the increasing needs of e-commerce and industrial activities. Also, increasing spending on infrastructure projects across the globe also creates high demand for high-performance trucks. The segment’s growth is in line with sustainable development, while at the same time meeting the efficiency requirements of today’s supply chains.
Propulsion Type Segment Analysis
By 2035, ICE segment is expected to capture over 75% commercial vehicles market share, attributed to the well-developed infrastructure and relatively affordable prices compared to electric vehicles. In October 2024, Ashok Leyland unveiled plans for setting up separate assembly lines for ICE and alternative energy vehicles to meet the current and future demands of ICE vehicles while shifting focus towards environment-friendly vehicles. Even with the drive towards ZEVs, ICEs are still useful in areas with little charging or refueling facilities. The reliability and flexibility of ICE trucks in any working environment make them remain relevant in the market.
Our in-depth analysis of the global commercial vehicles market includes the following segments:
|
Vehicle Type |
|
|
Propulsion Type |
|
|
Application |
|

Vishnu Nair
Head - Global Business DevelopmentCustomize this report to your requirements — connect with our consultant for personalized insights and options.
Commercial Vehicles Market Regional Analysis:
North America Market Insights
In commercial vehicles market, North America region is poised to capture around 47.7% share by the end of 2035, owing to the increased focus on manufacturing and innovation. In November 2024, Blue Bird Corporation, together with Girardin, acquired a bus manufacturing facility in New York; this increased Micro Bird’s production capacity and produced 350 jobs. Funded with USD 10 million in Excelsior Jobs Program tax credits and USD 2.5 million in capital grants, this program underlines the region’s efforts toward developing the commercial vehicle industry. The increasing requirement for school buses, multi-purpose vehicles, and commercial buses enables North America to dominate the commercial vehicles market.
The demand for school and commercial buses in the U.S. is rapidly growing owing to the enhanced infrastructure development and support from the government. The growth of Blue Bird mirrors the other trends in the industry, including a focus on development and increasing production. At the same time, cooperation between the state governments and manufacturers, for instance, underlines the strategic role of commercial vehicles in satisfying the requirements of both the public and the private sector and, thus, underscores the leading position of the U.S. in the commercial vehicles market.
In Canada, the NFI Group Inc.’s subsidiary Alexander Dennis ordered 29 Enviro500 double-deck buses for BC Transit in May 2024. These buses are constructed in cooperation with Big Rig Manufacturing and will improve public transportation in British Columbia. Funded by the regional government, the project is in line with the Canadian strategy of developing environmentally friendly and efficient means of transport and transportation, which strengthens its position in North America commercial vehicles market.
Asia Pacific Market Insights
Asia Pacific commercial vehicles market is expected to witness substantial growth till 2035, owing to the rising industrialization and development of infrastructure. For example, In September 2024, Ford announced that it had submitted a Letter of Intent (LOI) to the Government of Tamil Nadu, confirming its intention to use the Chennai factory for manufacturing and export. This facility is one of the many Ford projects in its aggressive expansionary strategy and will deal with the production of vehicles for export, thus cementing India’s position as a hub for commercial vehicle production.
The growth of India automotive manufacturing sector is fuelled by increasing local consumption, a strategic export approach, and government incentives. The Production Linked Incentive (PLI) scheme and investments in infrastructure development are driving the commercial vehicle segment. The increasing interest of local companies in manufacturing electric and other alternative fuel vehicles, as well as the collaboration with international companies to produce such vehicles, cement India as the leader in sustainable automotive solutions. India has stepped up to meet both domestic and international demand for commercial vehicles with a special emphasis on innovation and technology.
In China, the joint venture with Beijing Foton Daimler Automotive (BFDA) of Daimler Truck is expanding the market dominance of China in the commercial vehicles market. In 2022, the partnership launched a new plant in Beijing, which produces the localized version of the Mercedes-Benz Actros. These developments show that China is aiming to produce high-quality vehicles for the domestic and export markets, thus solidifying its position in the Asia Pacific.
Commercial Vehicles Market Players:
- AB Volvo
- Company Overview
- Business Strategy
- Key Product Offerings
- Financial Performance
- Key Performance Indicators
- Risk Analysis
- Recent Development
- Regional Presence
- SWOT Analysis
- Alexander Dennis Limited
- Ashok Leyland Limited.
- Blue Bird Corporation.
- BYD Motors
- Collins Bus Corporation
- Daimler Truck Holding AG
- Deccan Auto Limited
- Eicher Motors Limited
- Ford Motor Company
- Hyundai Motor Company
- ISUZU MOTORS
- Iveco Group NV.
- JBM Motor Limited
- Mahindra and Mahindra.
- PACCAR Inc.
- Tata Motors Limited.
- TEMSA
- The Lion Electric Company
- TRATON SE
- VDL Van Hool.
- Yutong Group
The commercial vehicles market is competitive, with players like AB Volvo, Daimler Truck Holding AG, Ashok Leyland Limited, BYD Motors, and Hyundai Motor Company leading the way in electric, hydrogen, and connected vehicles. These companies are using strategic alliances and acquisitions to increase their market share and technology capabilities. In October 2024, Volvo Group and Daimler Truck launched a joint venture to create a software-defined vehicle platform for heavy-duty commercial vehicles. This partnership reflects the current trends of the industry concerning digitalization and connectivity, as well as offering flexible and efficient solutions for commercial vehicle manufacturers. These strategic measures show the commitment of the sector to innovation and sustainability that will ensure future growth in the sector.
Here are some leading companies in the commercial vehicles market:
Recent Developments
- Volvo Group revealed an extended range for Volvo’s battery electric trucks, a new fully electric rear axle, which is spaced up for more batteries.
- Tata Motors Limited unveiled an extensive and comprehensive range of 21 new commercial vehicles added to Tata Motors' established “Power of 6” benefit proposition to address specific usage and applications while delivering higher productivity and lower total cost of ownership. They were designed and engineered to cater to the evolving needs of cargo and people transport across segments and applications (TCO).
- Report ID: 4429
- Published Date: Sep 09, 2025
- Report Format: PDF, PPT
- Explore a preview of key market trends and insights
- Review sample data tables and segment breakdowns
- Experience the quality of our visual data representations
- Evaluate our report structure and research methodology
- Get a glimpse of competitive landscape analysis
- Understand how regional forecasts are presented
- Assess the depth of company profiling and benchmarking
- Preview how actionable insights can support your strategy
Explore real data and analysis
Frequently Asked Questions (FAQ)
Commercial Vehicle Market Report Scope
Free Sample includes current and historical market size, growth trends, regional charts & tables, company profiles, segment-wise forecasts, and more.
Connect with our Expert


Copyright @ 2026 Research Nester. All Rights Reserved.
