Cloud TV Market Outlook:
Cloud TV Market size was valued at USD 1.8 billion in 2025 and is projected to reach USD 17.4 billion by the end of 2035, rising at a CAGR of 25.5% during the forecast period, i.e., 2026-2035. In 2026, the industry size of cloud TV is estimated at USD 2.2 billion.
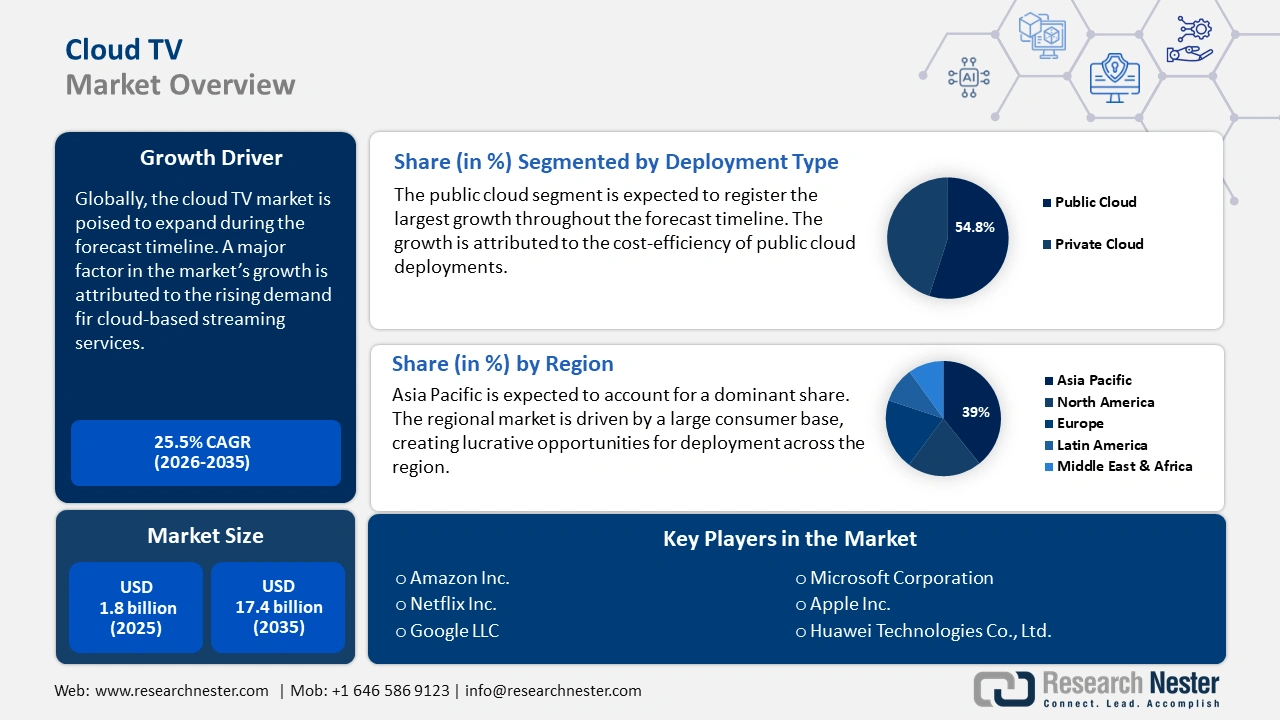
The rise in smart TV sales across the globe is one of the key factors boosting global market growth. As smart TVs are one of the primary platforms to access cloud-based streaming platforms, their growing popularity is directly boosting demand for Cloud TV services. For instance, Canalys, now part of Omdia, estimates that worldwide spending on cloud infrastructure services climbed to USD 90.9 billion in the first quarter of 2025, reflecting a 21% rise compared with the same period last year. This surge is largely fueled by faster internet access and the increasing number of people signing up for streaming services. Bottom of Form
Key Cloud TV Market Insights Summary:
Regional Highlights:
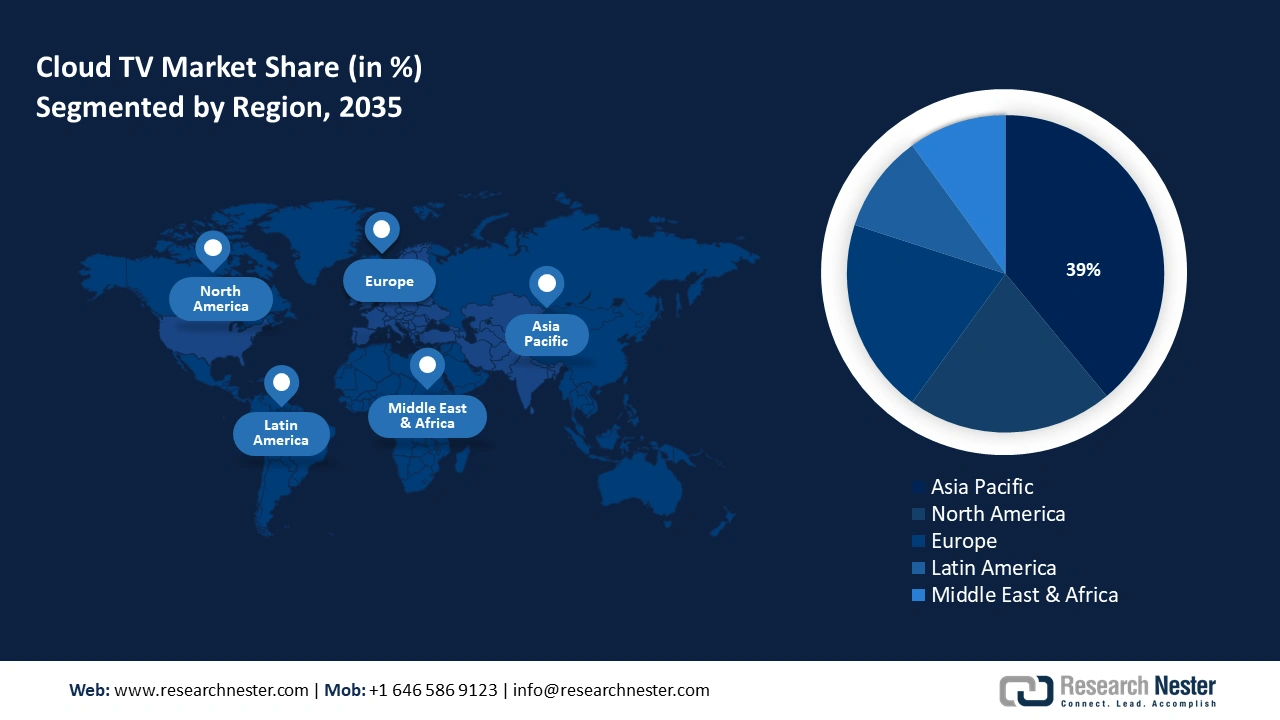
- By 2035, the Asia Pacific region is projected to command a 39% share of the cloud TV market, supported by its vast consumer base, region-specific content creation, and accelerating 5G rollout.
- North America is anticipated to grow at a 9.8% CAGR through 2035, reinforced by strong adoption of cloud-based streaming technologies and high disposable income levels.
Segment Insights:
- By 2035, the public cloud segment in the cloud TV market is forecasted to secure a 54.8% share, sustained by its scalability, cost efficiency, and ease of deployment.
- The media and entertainment segment is set to represent a 47.4% share by 2035, supported by rising OTT usage, live sports streaming demand, and multi-device content consumption.
Key Growth Trends:
- Proliferation of smart devices and connected TVs
- Advancements in 5G and edge computing
Major Challenges:
- Bandwidth and network infrastructure limitations
- Rising content licensing and cloud hosting costs
Key Players: Amazon, Inc., Netflix, Inc., Google LLC, Microsoft Corporation, Apple Inc., Huawei Technologies Co., Ltd., Samsung Electronics Co., Ltd., Sony Corporation, Rakuten, Inc., Baidu, Inc., Alibaba Group Holding Limited, Tata Consultancy Services (TCS), Airtel Digital TV, Astro Malaysia Holdings Berhad.
Global Cloud TV Market Forecast and Regional Outlook:
Market Size & Growth Projections:
- 2025 Market Size: USD 1.8 billion
- 2026 Market Size: USD 2.2 billion
- Projected Market Size: USD 17.4 billion by 2035
- Growth Forecasts: 25.5% CAGR (2026-2035)
Key Regional Dynamics:
- Largest Region: Asia Pacific (39% Share by 2035)
- Fastest Growing Region: North America
- Dominating Countries: United States, China, United Kingdom, Germany, Japan
- Emerging Countries: India, Brazil, South Korea, Indonesia, United Arab Emirates
Last updated on : 9 October, 2025
Cloud TV Market - Growth Drivers and Challenges
Growth Drivers
- Proliferation of smart devices and connected TVs: The proliferation of smart devices and connected TVs leads to an improved consumer experience by widening the scope of content available, thereby impacting the demand for cloud TV services. A major factor in the market’s expansion is the proliferation of smart devices across the world. Opportunities are rife in regional markets with customer bases with high or increasing disposable income. The surge in subscriptions to OTT (over-the-top) platforms clearly shows that consumers are moving away from traditional cable in favor of more flexible, internet-based viewing options. This shift leads to an improved consumer experience by widening the scope of content available and thereby impacting the demand for cloud TV services.
The latest Residential Energy Consumption Survey (RECS) by the U.S. Energy Information Administration in May 2022 shows a clear shift in how Americans connect their TVs. In 2020, 56% of U.S. households had at least one internet streaming device, nearly doubling from 29% in 2015. At the same time, 56% of homes relied on a set-top box in 2020, down from 76% five years earlier. Interestingly, about 27% of households used both a streaming device and a set-top box in 2020, a modest increase from 21% in 2015. - Advancements in 5G and edge computing: The rise of 5G is a significant factor driving the cloud TV market's growth curve. A key factor has been the integration of mobile edge computing (MEC) to shift data processing closer to the users. This allows a reduction of lag, leading to improved streaming. Additionally, the industry is dependent on providing lag-free streaming, and increased buffering curtails user retention. For cloud TV platforms trying to deliver smoother playback while juggling growing traffic, the integration of 5G and MEC serves as a major development. The table below highlights 5G deployment trends that are converging with the demand for cloud TVs.
|
Metric |
Value |
Timeframe |
|
Global 5G Connections |
Nearly 2 billion |
Q3 2024 |
|
U.S. 5G Coverage |
Over 329 million Americans are covered |
End of 2023 |
|
Malaysia 5G Adoption Rate |
51.8% nationwide |
December 2024 |
|
FCC Mid-Band Spectrum Allocated for 5G |
Over 600 MHz |
Ongoing |
Challenges
- Bandwidth and network infrastructure limitations: Although the adoption rates of cloud TV have surged, an impediment has arisen from inconsistency in broadband infrastructure. The constraint is especially visible in emerging markets. As per the International Telecommunication Union (ITU), by the end of 2023, more than 2.6 billion people lacked internet access globally, which had curtailed the reach of cloud TV platforms. Additionally, the fluctuation of network speeds in emerging economies, where 5G deployment is comparatively slow, creates a high churn rate in trial users of OTT-based streaming services. But despite the challenge, the current trends of heightened 5G deployment are set to navigate the constraint successfully by the end of 2037.
- Rising content licensing and cloud hosting costs: The cloud TV providers have faced mounting constraints due to operational costs. The rising costs are associated with content licensing. The increasing expenses cause impediments in the scalability of cloud TV platforms for mid-sized operators.
Cloud TV Market Size and Forecast:
| Report Attribute | Details |
|---|---|
|
Base Year |
2025 |
|
Forecast Year |
2026-2035 |
|
CAGR |
25.5% |
|
Base Year Market Size (2025) |
USD 1.8 billion |
|
Forecast Year Market Size (2035) |
USD 17.4 billion |
|
Regional Scope |
|
Cloud TV Market Segmentation:
Deployment Type Segment Analysis
The public cloud segment is predicted to hold a 54.8% and maintain its leading position by the end of 2035 due to its scalability, cost-effectiveness, and ease of deployment. It enables broadcasters and operators to deliver content seamlessly without investing heavily in on-premises infrastructure. With growing demand for OTT platforms and streaming services, public cloud adoption ensures faster time-to-market and global reach. Its pay-as-you-go model also attracts smaller players looking for flexibility and reduced operational costs. In August 2025, Globoplay (Brazil’s top streaming platform) utilized Harmonic’s VOS360 Media SaaS on a public cloud infrastructure to stream over 300 live soccer matches with low latency and broadcast-grade quality.
End user Segment Analysis
The media and entertainment segment is expected to account for a 47.4% share by the end of 2035. The segment’s expansion is fueled by the rising demand for OTT platforms, live sports streaming, and on-demand video services. Broadcasters and content providers leverage cloud TV to deliver scalable, high-quality, and personalized experiences to global audiences while reducing infrastructure costs. With the surge in 4K/8K content and multi-device consumption, this segment continues to drive market expansion at a rapid pace. For instance, in July 2025, Disney+ Hotstar partnered with AWS cloud services to optimize its streaming infrastructure during the ICC Men’s T20 World Cup, ensuring seamless delivery to millions of concurrent viewers in India.
Our in-depth analysis of the global market includes the following segments:
|
Segment |
Subsegments |
|
Deployment Type |
|
|
End user |
|
|
Service Model |
|

Vishnu Nair
Head - Global Business DevelopmentCustomize this report to your requirements — connect with our consultant for personalized insights and options.
Cloud TV Market - Regional Analysis
APAC Market Insights
APAC market is projected to hold a leading revenue share of 39% throughout the anticipated timeline. The growth of the regional market is favorably impacted by a large consumer base, driving the demand for cloud-based streaming services. In addition, major streaming providers who are actively creating region-specific content, and the heightened 5G deployment trends are expected to fuel market growth in the coming years.
The China cloud TV market is poised to hold a leading revenue share in APAC, with the market growth fueled by the surging adoption of IaaS by domestic enterprises. The market benefits from significant investments in digital infrastructure along with China’s push to provide country-wide ultra-fast internet connection. The proliferation of internet users has created a conducive environment for cloud TV services. A key data highlighting the potential expansion of revenue opportunities in the China market is the leading number of 5G base stations deployed and a whopping 466.0 million 5G subscribers.
In India, the market is expected to register rapid growth during the forecast period owing to rising purchasing power and exposure to advanced technologies. As per the reports by the Ministry of Information and Broadcasting (MIB), India has one of the oldest and most dynamic media and entertainment landscapes, and the M&E sector is expected to register a CAGR of 7% in the coming years. This is expected to fuel demand for smart TVs and cloud TVs in the future.
|
Segment |
2024 (USD billion) |
2025 (USD billion) |
2026 (USD billion) |
2027 (USD billion) |
|
Digital Media |
9.66 |
10.88 |
12.10 |
13.30 |
|
Television |
8.18 |
8.15 |
8.08 |
8.03 |
|
|
3.13 |
3.16 |
3.18 |
3.22 |
|
Online Gaming |
2.79 |
3.13 |
3.47 |
3.81 |
|
Filmed Entertainment |
2.25 |
2.36 |
2.46 |
2.57 |
|
Animation & VFX |
1.24 |
1.36 |
1.57 |
1.77 |
|
Live Events |
1.22 |
1.43 |
1.71 |
2.01 |
|
Out-of-Home Media |
0.71 |
0.80 |
0.88 |
0.95 |
Source: MIB
North America Market Insights
North America market is poised to exhibit rapid growth and expand at a CAGR of 9.8% throughout the forecast timeline, owing to the presence of major industry players such as Amazon Prime Video, Hulu, and Netflix. The companies have been at the forefront of adopting cloud-based technologies to provide high-quality content to the regional audience. Additionally, the region is populated with consumers having high disposable income rates, creating lucrative opportunities for the continued adoption of cloud TV services. For instance, in 2023, the U.S. Bureau of Economic Analysis (BEA) stated that the highest per capita disposable incomes in the U.S. were in USD 76,114 in Connecticut and USD 76,107 in Massachusetts, indicating strong consumer spending potential.
U.S. is projected to maintain its growth in the market throughout the forecast timeline, with a larger section of consumers moving from traditional cable TV to cloud-based streaming services. According to a May 2022 report by the U.S. Department of Commerce, the Biden-Harris administration has rolled out a USD 45 billion Internet for All program aimed at expanding access to affordable and reliable high-speed internet across the United States. The U.S. market also benefits due to the early adoption of cloud TV services.
U.S. OTT Subscriptions & Investments
|
Category |
Key Insights |
|
Subscriptions |
~245.3 million OTT users as of 2025 |
|
Investments |
$13.3B VC; major content and live-sports deals; high-profile startup funding |
Europe Market Insights
In Europe, the cloud TV market is anticipated to account for 25.1% of the global revenue share throughout the forecast period, underpinned by high-speed connectivity and rising demand for subscription-based video services. Other factors, such as rapid expansion of data-center and cloud infrastructure, increasing OTT consumption, and smart TV penetration, are expected to fuel market growth during the forecast period. Leading countries, including the UK, Germany, and France, are focused on innovation in cloud TV through sustainable streaming, multilingual content delivery, and GDPR-compliant service models.
In Germany, key platforms like Zattoo, Joyn, and Sky Deutschland are leveraging cloud infrastructure to deliver live TV, on-demand programming, and AI-powered personalization. Notably, in April 2024, ProSiebenSat.1’s Joyn migrated 3.4 petabytes of media archives to Amazon’s AWS using Snowball appliances, resulting in a 3× larger storage catalog at the same cost, and enabling scalable VoD delivery. Additionally, DAZN Germany implemented a cloud-native delivery architecture coupled with its own Edge Network to stream the FIFA Club World Cup 2025 with low latency and high concurrency for German viewers.
The France market is expected to register rapid growth during the forecast period, owing to rising demand for VoD and streaming services, high internet penetration, and availability of better networks and devices. Several companies are heavily investing in R&D activities as consumers are increasingly expecting on-demand content, personalization, and catch-up services. This is expected to fuel the demand for cloud TVs in the coming years.
Key Cloud TV Market Players:
- Amazon, Inc.
- Company Overview
- Business Strategy
- Key Product Offerings
- Financial Performance
- Key Performance Indicators
- Risk Analysis
- Recent Development
- Regional Presence
- SWOT Analysis
- Netflix, Inc.
- Google LLC
- Microsoft Corporation
- Apple Inc.
- Huawei Technologies Co., Ltd.
- Samsung Electronics Co., Ltd.
- Sony Corporation
- Rakuten, Inc.
- Baidu, Inc.
- Alibaba Group Holding Limited
- Tata Consultancy Services (TCS)
- Airtel Digital TV
- Astro Malaysia Holdings Berhad
The global cloud TV market remains highly competitive, with key players seeking to provide improved content and viewing. Leading companies from Amazon to Netflix dominate the market with considerable revenue shares. The key players in the sector are seeking to expand their cloud TV services, while opportunities remain rife to provide localized solutions. The table below highlights the major players in the market along with their revenue share in 2024.
Recent Developments
- In May 2025, Netflix announced a major redesign of its TV application. This was one of the first major updates in over a decade for Netflix. The new interface is poised to provide personalized content recommendations in a bid to curtail decision fatigue.
- In April 2025, Zattoo, a prominent European Cloud TV provider, released its 2025 TV Streaming Report for Germany, highlighting a significant shift in viewing habits. The report indicates that 43% of German viewers now primarily access television content via the internet, marking a steady trend away from traditional cable and satellite methods. This shift highlights the increasing consumer preference for internet-based TV reception, which remains at a high level.
- In July 2024, Amazon Prime Video announced a redesign of its platform. The initiative aims to improve the user experience via the use of Amazon Bedrock. Additionally, a content-forward navigation bar was introduced to ease browsing.
- Report ID: 2917
- Published Date: Oct 09, 2025
- Report Format: PDF, PPT
- Explore a preview of key market trends and insights
- Review sample data tables and segment breakdowns
- Experience the quality of our visual data representations
- Evaluate our report structure and research methodology
- Get a glimpse of competitive landscape analysis
- Understand how regional forecasts are presented
- Assess the depth of company profiling and benchmarking
- Preview how actionable insights can support your strategy
Explore real data and analysis
Frequently Asked Questions (FAQ)
Cloud TV Market Report Scope
Free Sample includes current and historical market size, growth trends, regional charts & tables, company profiles, segment-wise forecasts, and more.
Connect with our Expert


Copyright @ 2026 Research Nester. All Rights Reserved.
