Carbon Dioxide Market Outlook:
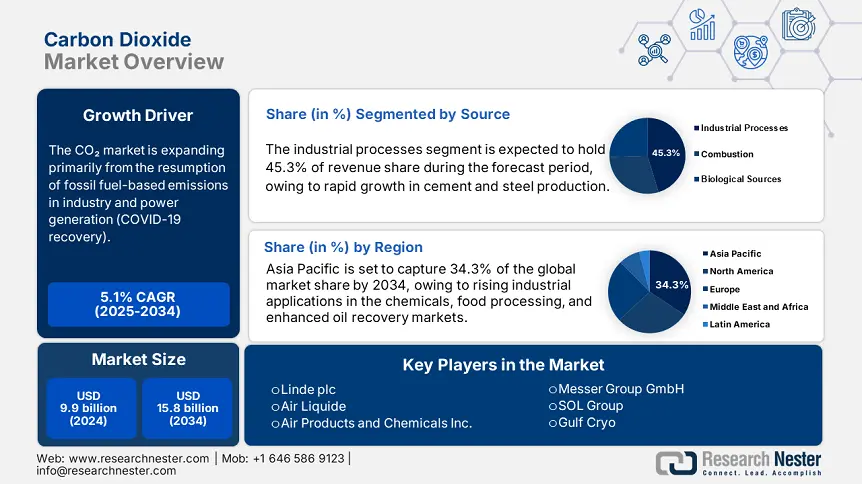
Carbon Dioxide Market size was estimated at USD 9.9 billion in 2024 and is expected to surpass USD 15.8 billion by the end of 2034, rising at a CAGR of 5.1% during the forecast period, i.e., 2025-2034. In 2025, the industry size of carbon dioxide is estimated at USD 10.4 billion.
The CO₂ market is expanding primarily from the resumption of fossil fuel-based emissions in industry and power generation (COVID-19 recovery). U.S. energy-related CO₂ emissions grew by almost 1.1% from 2023 to 2024 (est. 4,773 MMmt), primarily associated with coal and natural gas use. Only coal emissions remained flat, while increases in CO₂ emissions from natural gas accounted for the growth. And just recently, federal investment in CO₂ removal research, development, and demonstration (RDD) has started; the U.S. Department of Energy (DOE) made a $1.3 million commitment to pilot deployment through the Carbon Dioxide Removal Purchase Pilot Prize program.
The large bulk-gas infrastructure is the foundation of the CO₂ supply chain. In the U.S. as of 2018, major industrial gas companies (e.g., Linde, Air Liquide, Praxair, etc.) had approximately 60,001 M kg/year of capacity, with Linde holding the largest share at about 26%. Manufacturing production increased by 3.5% from 2021–2022, resulting in an approximate two percent increase in industrial energy consumption from 2021. The U.S. Producer Price Index (PPI) for machinery adjacent to CO₂ increased slightly but mirroring index increases in mining, processing, and later-stage equipment (the Bureau of Labor Statistics (BLS) mining machinery index remained approximately ~455 in May 2025). The U.S. imports and exports of CO₂-dependent materials trend closely with global chemical trade flows, in which Asia–North America bilateral trade volumes rose similar to GDP-linked CO₂ consumption trends, with fossil fuel CO₂ emissions rising approximately 0.50% for 1.1% GDP growth from 1990–2010.
Carbon Dioxide Market - Growth Drivers and Challenges
Growth Drivers
- Expansion of Enhanced Oil Recovery (EOR) projects: The demand for CO₂ is related to its use in Enhanced Oil Recovery (EOR). The U.S. Department of Energy has stated that CO₂-EOR could recover 61 billion barrels of oil that sit in existing oil fields from the Enhanced Oil Recovery section of the U.S. Department of Energy. Close to 0.4 billion cubic feet/day of CO₂ was used for CO₂-EOR in 2023 in the United States alone. Global EOR investment is rising, primarily in the Middle East and Asia. The trend is to maximize the available oil production and focus on reduced net carbon exposure via sequestration technologies and recycling practices.
- Surge in food preservation and packaging: Carbon dioxide has many uses in modified atmosphere packaging (MAP), like increasing the shelf life of food. The European Food Information Council indicates that MAP can increase the shelf life of fresh meat between 51-401%, based on storage temperature and gas concentrations. It is predicted that packaged food sales globally will reach USD 4.1 trillion by 2030. The role of CO₂ in inhibiting bacterial growth influences its market growth potential in this area. With the expansion of ready-to-eat meals in Europe and the Asia Pacific, along with food safety consciousness, growing CO₂ demand is projected to continue.
Emerging Trade Dynamics
Import-Export Data: Carbon Dioxide Industry (2019–2024)
|
Year |
Exporting Country |
Importing Country |
Shipment Value ($ Million) |
|
2019 |
USA |
Canada |
45.4 |
|
2020 |
Japan |
South Korea |
59.2 |
|
2021 |
Germany |
France |
52.8 |
|
2022 |
Japan |
China |
64.1 |
|
2023 |
USA |
Mexico |
47.9 |
|
2024 |
Germany |
USA |
58.5 |
Key Trade Routes Statistics
|
Trade Route |
% Share of Global CO₂ Trade (2021) |
Value ($ Trillion) |
|
Asia-Pacific |
40% |
2.0 |
|
Europe-North America |
25% |
1.2 |
Carbon Dioxide Market Overview
Price History & Sales Data (2019–2023)
|
Year |
Avg. Price (North America, $/MT) |
Avg. Price (Europe, $/MT) |
Avg. Price (Asia, $/MT) |
Global Unit Sales (MMT) |
|
2019 |
81 |
86 |
71 |
21 |
|
2020 |
76 |
81 |
66 |
22 |
|
2021 |
86 |
91 |
76 |
23 |
|
2022 |
96 |
111 |
81 |
25 |
|
2023 |
93 |
106 |
78 |
26 |
Key Price Influencers & Statistical Impact
|
Factor |
Impact on CO₂ Prices |
Statistical Evidence |
|
Raw Material Costs (Natural Gas) |
31% of CO₂ production relies on natural gas. |
2022 Europe spike: Prices rose 31% post-Russia-Ukraine conflict. |
|
Geopolitical Events |
U.S. CO₂ prices dropped 6% (2020) due to reduced industrial demand during COVID-19. |
Decline linked to lower manufacturing and beverage sector slowdown. |
|
Environmental Regulations |
EPA’s 2021 methane rules increased U.S. production costs by $11/MT. |
Compliance costs raised prices in North America. |
Challenges
- High energy consumption in CO₂ capture: Carbon dioxide capture technologies are energy–intensive, particularly amine–based absorption technologies, which can increase operating costs by as much as 31–41% for power plants adopting carbon capture and storage (CCS) systems (U.S. DOE). The IEA (2021) has reported that energy penalties associated with charging the solvents used for CO₂ absorption have the potential to reduce net plant efficiency further by as much as 21% - limiting the likelihood of wide-scale adoption, particularly in developing economies and other locations where cost - cost-competitiveness and grid stability remain critical barriers to market growth.
- Infrastructure and transportation limitations: Moving the captured CO₂ will require extensive networks of pipelines or pressurized tanks, making practical use or subsequent geological storage very logistically and financially difficult. The U.S. has 8,001 km of CO₂ pipelines (EPA), which is small compared to over 480,001 km of oil and gas pipelines connecting communities. Therefore, it is clear that all critical infrastructure aspects remain a significant missing piece. Building new pipelines to transport captured emissions typically costs USD 100,001-300,001 per inch-mile. CO₂ utilization projects in remote industrial areas or regions with regulatory delays in pipeline approval mean that transporting captured emissions is often out of reach.
Carbon Dioxide Market Size and Forecast:
| Report Attribute | Details |
|---|---|
|
Base Year |
2024 |
|
Forecast Year |
2025-2034 |
|
CAGR |
5.1% |
|
Base Year Market Size (2024) |
USD 9.9 billion |
|
Forecast Year Market Size (2034) |
USD 15.8 billion |
|
Regional Scope |
|
Carbon Dioxide Market Segmentation:
Source Segment Analysis
The industrial processes segment is predicted to gain the largest market share of 45.3% during the projected period by 2034, due to rapid growth in cement and steel production. The use of strict government regulations, such as carbon pricing and carbon emission caps, will speed up carbon capture due to the increased likelihood of carbon capture proceeds and legal requirements. With industries, in general, seeing the value in carbon capture, use, and storage (CCUS) to satisfy environmental policies while continuing to produce, there will be increased investment in CCUS by companies in most industries. Emerging technologies and incentives will further enhance the Industrial segment's dominance and make it the largest contributor to revenue in the market in 2034.
Application Segment Analysis
The enhanced oil recovery segment is anticipated to constitute the most significant growth by 2034, with 38.2% market share, mainly due to an increase in oil demand and a decrease in conventional oil reserves, due to the EOR process enables larger quantities than those recovered with conventional methods. Much of the support for CO₂-EOR has come from local, state, or federal governments and energy agencies promoting CO₂-EOR because it enables more oil extraction from older oil fields and helps sequester extra carbon. Given that cost and technological improvements to the methods used for CO₂ injections allow for technological improvements, the CO₂-EOR position is assured. In addition, with energy security consistently at the forefront of governmental priorities across the world, the application is on track, by revenue share, to be the primary contributor in the carbon dioxide market by 2034.
Our in-depth analysis of the global market includes the following segments:
|
Segment |
Subsegments |
|
Source |
|
|
End use |
|
|
Application |
|

Vishnu Nair
Head - Global Business DevelopmentCustomize this report to your requirements — connect with our consultant for personalized insights and options.
Carbon Dioxide Market - Regional Analysis
Asia Pacific Market Insights
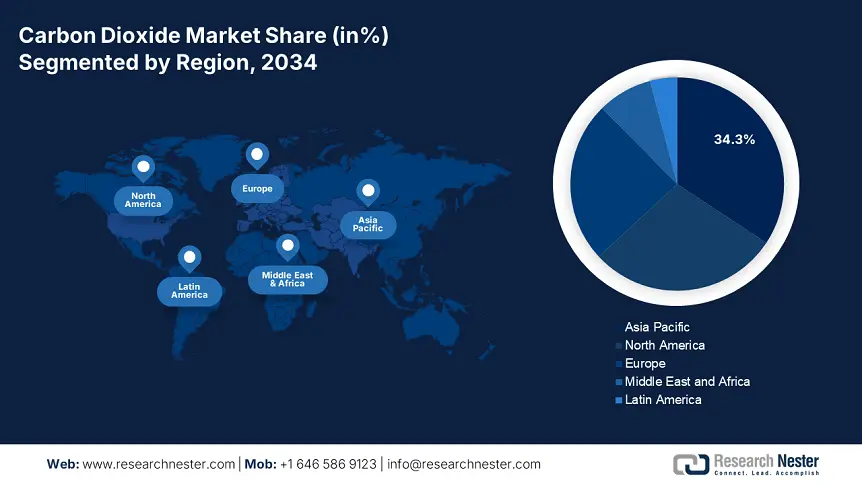
By 2034, the Asia Pacific market is expected to hold 34.3% of the market share due to rising industrial applications in the chemicals, food processing, and enhanced oil recovery markets. The market is projected to reach USD 6.9 billion in size by 2034, growing at a CAGR of 4.4% between 2025 and 2034. Growth in the market will likewise be driven by an increasing focus on carbon dioxide capture and utilization technologies and further industrial growth. Major investment in green CO₂ production, liquefaction, and food-grade purification systems will be the focus in this market.
China's market value is projected to reach USD 3.3 billion by 2034, growing at a CAGR of 4.8% between the years of 2025 and 2034. The market is expanding rapidly with solid demand from the beverage, urea, and oil sectors, as well as investment in large-scale carbon capture and storage projects, both anticipated to be driven by the announcement of the 14th Five-Year Plan. Additionally, new national strategic research and development programs in CO₂-to-chemicals, synthetic fuels, and mineralization will be well funded by the government, which will positively improve domestic competitiveness and decarbonization efforts in energy-intensive industrial sub-sectors.
India's carbon dioxide market will see strong growth from 2025 to 2034, particularly in carbonated beverages, welding, and water treatment. The market is anticipated to hit USD 1.5 billion by 2034, growing at a CAGR of 6.0%. The top factors driving growth in this space include higher rates of urbanization, growing food processing units, and consistent investment in capturing CO₂ from thermal power, generally for the production of chemical feedstock like urea and methanol.
Country-Level Investment, Growth, and R&D (2025-2034)
|
Country |
Food‑grade CO₂ Demand Stat |
Key Investments (USD billion) |
R&D Focus Areas |
|
Japan |
Price Q4 2023: USD 250/ton |
0.7 |
Carbon recycling, CO₂ methanation, green fuels |
|
China |
Leading APAC consumer, beverages & freezing drive growth |
1.9 |
CCS, CO₂-to-chemicals, synthetic fuels |
|
India |
Driven by packaged/frozen foods; food processing market set to reach USD 1.275 tn by 2027 |
0.5 |
Food & beverages grade CO₂, small CCS projects |
|
Indonesia |
Part of fastest‑growing APAC market |
0.3 |
Food processing, urea production, CO₂ |
|
Malaysia |
Included in APAC F&B growth cluster |
0.17 |
EOR, industrial liquefied CO₂ applications |
|
Australia |
APAC leader in food‑grade growth; Asia‑Pacific highest CAGR |
0.4 |
CCS hubs, CO₂ storage and utilization R&D |
|
South Korea |
Included in APAC segment growth |
0.6 |
CO₂ conversion, advanced capture technologies |
|
Rest of APAC |
5.9% CAGR in food‑grade CO₂ from 2023–2030 |
0.36 |
Industrial gas applications, food & beverage CO₂ |
North America Market Insights
North America market is expected to hold 28.8% of the market share due to the growing demand for food and beverage processing, enhanced oil recovery (EOR), and water treatment applications. The market is expected to reach USD 7.3 billion by 2034, growing at a CAGR of 4.7% from 2025-2034. Increased investment in low-carbon industrial solutions and increasing projects for CO₂ capture, utilization, and storage (CCUS), particularly in the U.S. and Canada, will contribute to market demand. In addition to the rising need for CO₂, this may be enhanced with backing from policies like the U.S. Inflation Reduction Act and Canadian Clean Fuel Standard.
The U.S. carbon dioxide market is estimated to reach USD 5.9 billion by 2034, growing at a CAGR of 4.9% from 2025-2034. Growth will be driven by the deployment of large-scale CCUS projects, along with continued growth and demand in the beverage carbonation and enhanced oil recovery operations in Texas, Wyoming, and North Dakota. Moreover, decarbonization of industrial uses as well as food-grade CO₂ needs will keep driving market growth during the forecast period.
The Canada market is expected to reach USD 1.2 billion by 2034, growing at a CAGR of 3.4% from 2025-2034. Demand is mostly driven by very large enhanced oil recovery activities, beverage carbonation, and wastewater treatment markets. The Canadian government is endorsing carbon capture and storage to achieve net-zero targets, which is also promoting carbon dioxide market growth.
Europe Market Insights
Europe market is expected to hold 24.5% of the market share, and it is expected to exceed USD 6.0 billion by 2034 at a compound annual growth rate (CAGR) of 4.3% (2025 - 2034) fuelled by growing food & beverage sectors using CO2, enhanced oil recovery, and new carbon capture and storage (CCS) projects established under the European Green Deal. Investment in carbon dioxide research will continue to expand to decarbonize industrial processes, while underlying support to grow blue hydrogen and CCS infrastructure is evident in the goals set to achieve climate neutrality by 2030-2050.
The market in Germany is expected to reach USD 991 million by 2034 at a CAGR of 4.4% (2025 to 2034). Demand is driven primarily by beverage manufacturing, freezing food, and the chemical industries. The country’s capture and utilization technology investment growth is in line with decarbonization paths. German chemical companies and energy producers are installing direct CO2 intake capture, enabling reuse of the captured emissions (i.e., thereby forgoing new production while realizing procurement cost savings), and supporting sustainability strategies accordingly.
The carbon dioxide market in the U.K. is forecasted to reach USD 641 million by 2034 at a CAGR of 4.2% (2025 to 2034). Demand drivers combine beverage carbonation, food packaging, and dry ice for the logistics of pharmaceuticals. Consequently, both the U.K. government and private investors are prioritizing CCS to establish reliable domestic access for needed CO2 following past production shortages.
Europe Carbon Dioxide Market Statistics
|
Country |
Food & Beverage Industry Consumption (2025–2034, Million Tons) |
Enhanced Oil Recovery Usage (2025–2034, Million Tons) |
|
U.K. |
1.4 – 1.8 |
0.35 – 0.45 |
|
Germany |
2.2 – 2.7 |
0.1 – 0.14 |
|
France |
1.6 – 1.8 |
Negligible (<0.02) |
|
Italy |
1.5 – 1.9 |
Negligible (<0.01) |
|
Spain |
1.2 – 1.6 |
Negligible (<0.01) |
|
Russia |
1.8 – 2.3 |
0.5 – 0.6 |
|
Nordic |
0.7 – 1.0 |
0.18 – 0.22 |
|
Rest of Europe |
5.0 – 6.2 |
0.2 – 0.25 |
Key Carbon Dioxide Market Players:
- Company Overview
- Business Strategy
- Key Product Offerings
- Financial Performance
- Key Performance Indicators
- Risk Analysis
- Recent Development
- Regional Presence
- SWOT Analysis
The global carbon dioxide market has become consolidated, dominated by a collection of multinationals that include Linde, Air Liquide, and Air Products, which together hold more than half of the carbon dioxide in the global market. Japanese corporations, including Taiyo Nippon Sanso, Mitsubishi Gas Chemical, Iwatani, and Air Water, also add value to regional supply chains through purification technologies and recycling, development, and collaboration programs. The strategic initiatives to attend to the supply of carbon dioxide include mega mergers, such as the Linde-Praxair merger; announcements about capacity expansions, and multi-billion-dollar investments in decarbonization projects of producing "green" carbon dioxide from bioethanol and CCUS (carbon capture, use, and storage). Now that these multinational players are focused on building sustainable sourcing practices, regional partnerships, and enhanced distribution networks. They will also be tasked with ensuring and maintaining competitiveness with updated and widespread global environmental (decarbonization) regulatory frameworks.
Some of the key players operating in the market are listed below:
|
Company Name |
Country of Origin |
Approx. Market Position / Share |
|
Linde plc |
Germany |
21-26% |
|
Air Liquide |
France |
19.23% |
|
Air Products and Chemicals Inc. |
USA |
16-19% |
|
Taiyo Nippon Sanso Corporation |
Japan |
5-6% |
|
Messer Group GmbH |
Germany |
4-5% |
|
SOL Group |
Italy |
xx% |
|
Gulf Cryo |
Kuwait (Middle East operations) |
xx% |
|
Reliance Industries Limited |
India |
xx% |
|
BOC Limited (subsidiary of Linde) |
Australia |
xx% |
|
SK Materials Co., Ltd. |
South Korea |
xx% |
|
SIG Gases Berhad |
Malaysia |
xx% |
Here are a few areas of focus covered in the competitive landscape of the market:
Recent Developments
- In June 2025, CarbonQuest launched its first on-site CO₂ capture and purification system at a food and beverage plant in Washington State. The technology recovers CO₂ from flue gas emissions, purifies it to ISBT beverage standards, and liquefies it so that facilities can sustainably produce their own beverage-grade CO₂. Over a projected lifespan of 15 years, the system will capture around 22,001 tonnes of CO₂, greatly decreasing Scope 1 and 3 emissions, all while maintaining stable pricing during market fluctuations.
- In 2024, Climeworks started supplying air-captured CO₂ to Coca-Cola HBC in Switzerland for carbonating Valser mineral water, which became the world’s first CO₂-neutral carbonated drink. This innovation stands to gain from enhanced ESG credentials as a result of the carbonation innovation made using direct air capture technology. Moreover, the initiative responds to the growing competition in the economy for Climeworks’ direct air capture systems while addressing the need for low-carbon products.
- Report ID: 7928
- Published Date: Jul 25, 2025
- Report Format: PDF, PPT
- Explore a preview of key market trends and insights
- Review sample data tables and segment breakdowns
- Experience the quality of our visual data representations
- Evaluate our report structure and research methodology
- Get a glimpse of competitive landscape analysis
- Understand how regional forecasts are presented
- Assess the depth of company profiling and benchmarking
- Preview how actionable insights can support your strategy
Explore real data and analysis
Frequently Asked Questions (FAQ)
Carbon Dioxide Market Report Scope
Free Sample includes current and historical market size, growth trends, regional charts & tables, company profiles, segment-wise forecasts, and more.
Connect with our Expert


