Automotive Operating System Market Outlook:
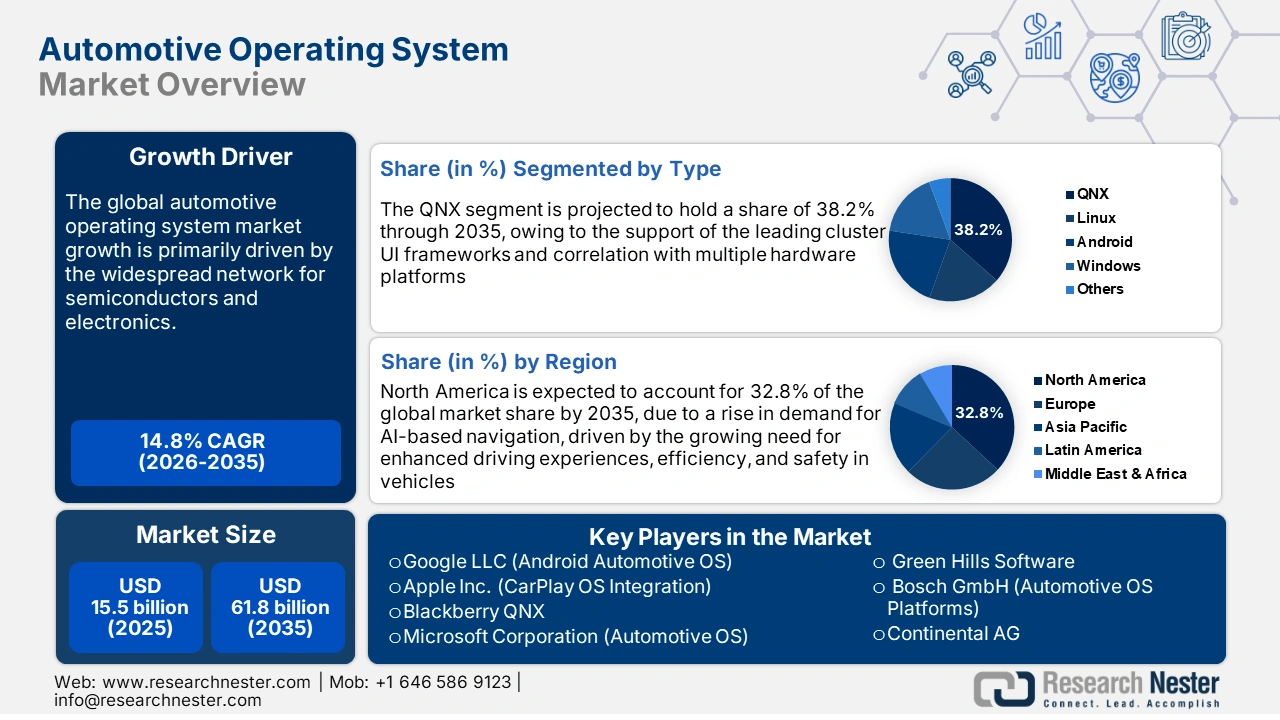
Automotive Operating System Market was valued at USD 15.5 billion in 2025 and is projected to reach USD 61.8 billion by the end of 2035, rising at a CAGR of 14.8% during the forecast period, i.e., 2026-2035. In 2026, the industry size of automotive operating systems is assessed at USD 17.8 billion.
The supply chain for the automotive operating system market is closely tied to a widespread network for semiconductors and electronics. Raw materials, including rare earth elements, silicon, and copper, are sourced from various countries in South America and the Asia Pacific. AOS platforms are integrated with chipsets and ECUs, whose production relies primarily on rare earth metals from China. Companies and governments are also active in the production of rare earth materials, contributing to mitigating supply chain disruptions in the production of the automotive operation system. As reported by the Center for Strategic and International Studies (CSIS), a U.S.-based company, MP Materials produced a record 1,300 tons of neodymium-praseodymium (NdPr) oxide in 2024. A projected 300,000 tons of NdFeB magnets were produced in China in the same financial year.
Semiconductors are the backbone of automotive operating systems, as several modern automotive OS rely on advanced semiconductor chips such as SoCs, MCUs, GPUs, and AI accelerators. In July 2025, the U.S. Bureau of Labor Statistics (BLS) disclosed a 6.1% surge in the Producer Price Index for the manufacturing of semiconductors over the period of the last 3 years, from December 2021 to December 2024. The rise was seen due to constant disruptions in the supply chain and persistent geopolitical tensions.
U.S. Semiconductor Industry Import/Export Price Trends
|
Categories Of Trends |
Surge Or Decline In 2022 |
Surge Or Decline In 2023 |
Surge Or Decline In 2024 |
|
Annual change in the Producer Price Index for semiconductor manufacturing |
+3.9% |
-0.1% |
+2.2% |
|
Annual changes in the export price index |
+1.4% |
-4.7% |
-0.2% |
|
Annual changes in the import price index |
+2.4% |
-3.8% |
0.0% |
Source: BLS
As per the same report, in 2024, North America established itself as the leader in the global chip supply chain, and more than 70% of the U.S. semiconductor exports took place in Texas, Oregon, California, New Mexico, Arizona, and New York.
Top Six Exporting U.S. States and Territories for Semiconductor Manufacturing In 2024
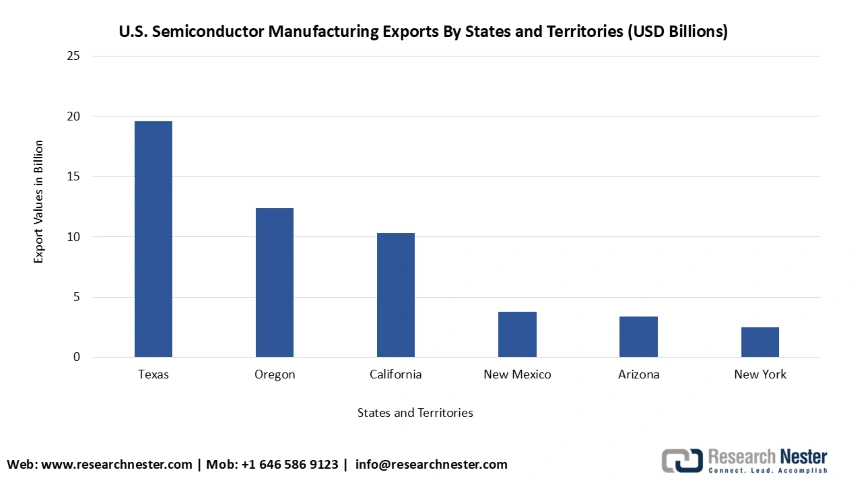
Source: BLS
Moreover, the United States International Trade Commission revealed in November 2024 that automotive parts imports from China increased from USD 2.0 billion in 2013 to USD 5.3 billion in 023 in Mexico. As evidence of continuous investment in creating cutting-edge mobility infrastructure, an investment of USD 54 million was announced by the U.S Department of Transportation for 34 projects taking place in the final round of the SMART Stage 1 Grants across 21 states.