Aluminum Beverage Packaging Market Outlook:
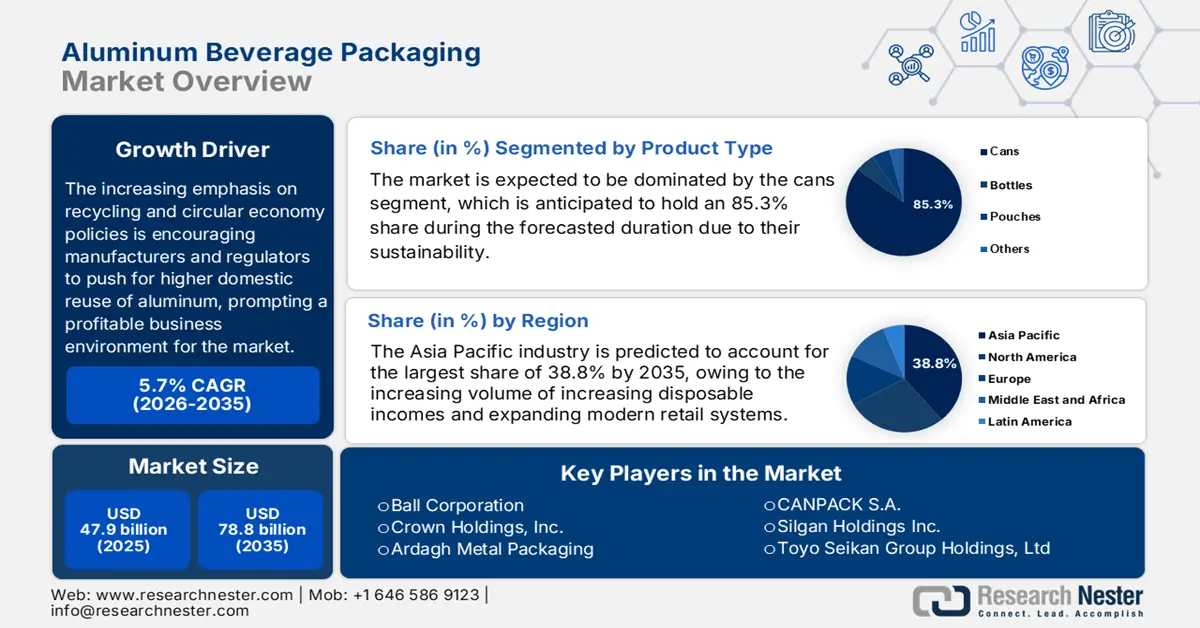
Aluminum Beverage Packaging Market size was valued at USD 47.9 billion in 2025 and is projected to reach USD 78.8 billion by the end of 2035, rising at a CAGR of 5.7% during the forecast period, i.e., 2026-2035. In 2026, the industry size of aluminum beverage packaging is estimated at USD 50.6 billion.
The increasing emphasis on recycling and circular economy policies is encouraging manufacturers and regulators to push for higher domestic reuse of aluminum, prompting a profitable business environment for the market. As of the October 2025 data revealed by the U.S. Environmental Protection Agency, the U.S. generated approximately 1.92 million tons of aluminum containers and packaging, which accounts for 0.7% of municipal solid waste, with beverage cans representing the largest share in a year. It also stated that out of this, 670,000 tons were recycled, corresponding to a 50.4% recycling rate, whereas 13% was combusted for energy recovery, and the remaining 52.1% was landfilled. In addition, the historical data show steady growth in generation, reflecting increased consumption and packaging demand, positively impacting market growth.
In terms of the raw‑material supply chain and manufacturing capacity, the aluminum beverage packaging market has witnessed an increased reliance on secondary (scrap-derived) aluminum. The analysis by PUBS USGS states that the aluminum industry in the U.S. experienced domestic smelter capacity of 1.36 million tons per year. It states that aluminum recovered from purchased scrap totaled approximately 3.3 million tons, out of which 55% derived from new manufacturing scrap and 45% from old scrap, representing about 38% of apparent consumption. Imports of crude and semi-manufactured aluminum amounted to 4.8 million tons, whereas the exports surpassed 1.2 million tons, which reflects a net import reliance of 44% for domestic consumption. Furthermore, the average U.S. market price of aluminum ingots decreased by 15% to 130 cents per pound, highlighting market adjustments.
U.S. Aluminum Production, Consumption, Trade, and Pricing Statistics (2019 to 2-23)
|
Metric |
Value |
|
Primary Aluminum Production |
750 thousand tons |
|
Secondary Production (Old Scrap) |
1,500 thousand tons |
|
Secondary Production (New Scrap) |
1,800 thousand tons |
|
Aluminum Recovered from Scrap |
3.3 million tons |
|
Imports (Crude & Semi-manufactures) |
4.8 million tons |
|
Exports (Crude & Semi-manufactures) |
1.2 million tons |
|
Net Import Reliance |
44% |
|
Average Market Price |
130 cents/lb |
|
Domestic Smelter Capacity |
1.36 million tons/year |
|
Employment |
30,000 |
Source: PUBS USGS