Additives Market Outlook:
Additives Market size was valued at USD 172.1 billion in 2024 and is projected to reach a valuation of USD 341 billion by the end of 2037, rising at a CAGR of 5.4% during the forecast period, i.e., 2025-2037. In 2025, the industry size of additives is evaluated at USD 181 billion.
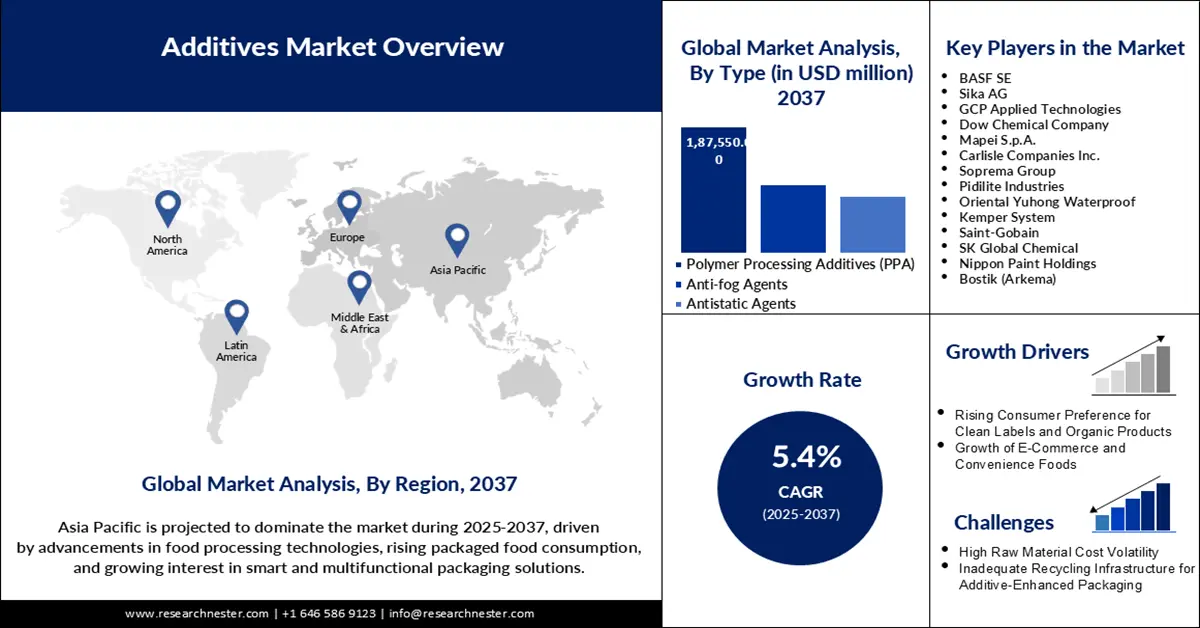
The additives market is garnering a significant rate, driven by growing demand for sustainable and high-performance packaging materials. Companies are developing bio-based and biodegradable additives to address stringent environmental regulations and consumer demands. In February 2025, BASF India announced a new plant to increase its production capacity for Cellasto microcellular polyurethane (MCU). The move is evidence of the industry's focus on green solutions, favoring circular economic principles.
One of the crucial trends in the additives market is the intersection of digital technologies and AI-enabled R&D to speed up additive functionality and sustainability. The DOE announced $68 million in funding for 11 multi-institution projects to develop new foundation models for AI. This intersection of digital technology and sustainability is driving the development of next-generation additives. Regulatory bodies, including Health Canada, are also demanding absolute transparency of additive formulations, enhancing consumer confidence and facilitating cross-border audits. These drivers are harmonizing to drive robust market growth and innovation.
Key Additives Market Insights Summary:
Regional Highlights:
- North America additives market is expected to grow at a CAGR of 5.3% from 2025 to 2037, supported by heightened regulatory transparency requirements and strong innovation in sustainable, compliant additive solutions.
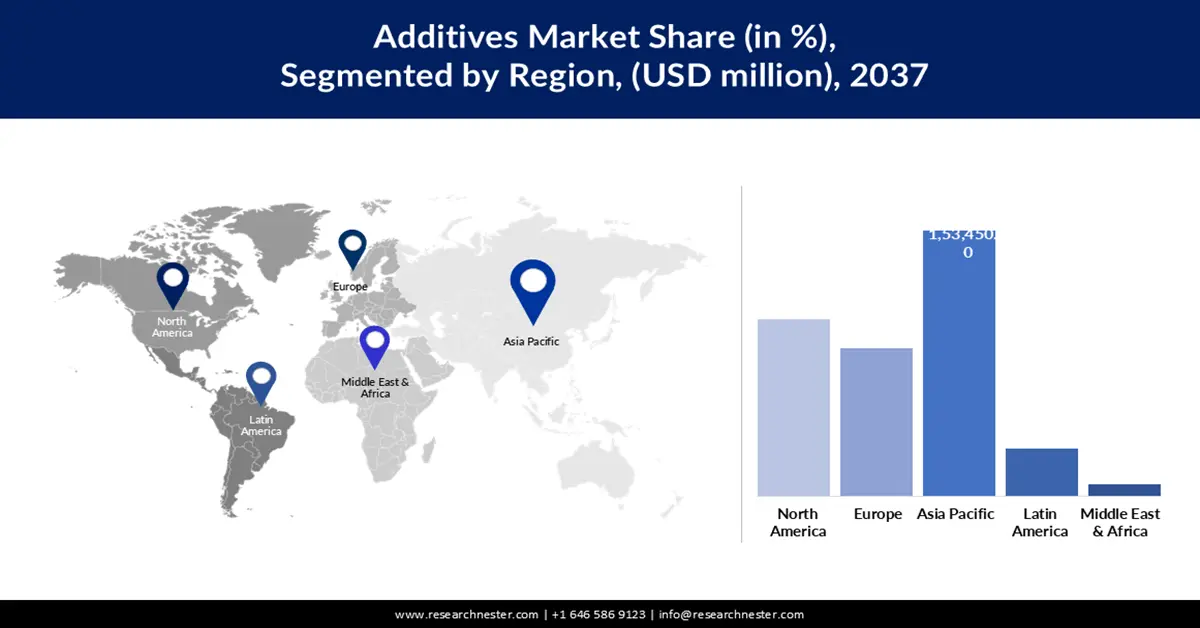
- Asia Pacific is anticipated to reach a 45% market share during the forecast period, propelled by rapid industrialization, expanding manufacturing capacity, and rising demand for bio-based, compostable additives.
Segment Insights:
- The external/surface coatings segment is projected to hold a 60% market share by 2037, driven by its role in improving material protection, aesthetics, and barrier performance against moisture, UV exposure, and oxygen.
- The polymer processing additives (PPA) segment is expected to maintain a 55% share throughout the forecast period, supported by its ability to enhance polymer quality, processing stability, and compatibility with recycled materials.
Key Growth Trends:
- Increasing need for biodegradable and sustainable packaging materials
- Regulatory focus on traceability and safety of additives fuels innovation
Major Challenges:
- Stringent regulatory compliance
- Legislative restrictions on additive chemicals
Key Players: Sika AG, GCP Applied Technologies, Dow Chemical Company, Mapei S.p.A., Carlisle Companies Inc., Soprema Group, Pidilite Industries, Oriental Yuhong Waterproof, Kemper System, Saint-Gobain, SK Global Chemical, Nippon Paint Holdings, Bostik (Arkema), Petronas Chemicals Group, Nisshin Kogyo Co. Ltd., Mitsubishi Chemical Group, Taiyo Kogyo Corporation, Toray Industries.
Global Additives Market Forecast and Regional Outlook:
Market Size & Growth Projections:
- 2024 Market Size: USD 172.1 billion
- 2025 Market Size: USD 181 billion
- Projected Market Size: USD 341 billion by 2037
- Growth Forecasts: 5.4% CAGR (2025-2037)
Key Regional Dynamics:
- Largest Region: Asia Pacific (45% Share by 2037)
- Fastest Growing Region: Europe
- Dominating Countries: Germany, United States, China, Japan, France
- Emerging Countries: India, Indonesia, Brazil, Vietnam, Mexico
Last updated on : 23 September, 2025
Additives Market Growth - Drivers and Challenges
Growth Drivers
- Increasing need for biodegradable and sustainable packaging materials: A primary growth driver for the additives industry is the rising demand for compostable and sustainable packaging materials. In February 2024, Canada government invested CAD $1 million in BOSK Bioproducts, a Québec-based company specializing in compostable bioplastics. This momentum is propelling the adoption of ASTM D6400-certified additives, which enables brands to meet consumers' demands for sustainable packaging. Pressure to be sustainable is also compelling innovation in bio-based additives that improve barrier functionality and reduce environmental footprint. With rising numbers of nations embracing compostability and recyclability standards, the next-generation sustainable additives industry is set to expand.
- Regulatory focus on traceability and safety of additives fuels innovation: The greater regulatory emphasis on additive safety and traceability is another factor for the market growth. For instance, in February 2024, the FDA announced that it had effectively eliminated the use of per- and polyfluoroalkyl substances (PFAS) as grease-proofing agents in food packaging. This has encouraged manufacturers to invest in safer and more transparent additive products. Mexico's 2024 tax credits to producers of bio-based additives are also boosting local production and R&D as per global green standards. Such regulatory and fiscal initiatives are making the additives market stronger and innovative to facilitate both local and international competitiveness.
Challenges
- Stringent regulatory compliance: One of the notable barriers in the industry is the increasing regulatory compliance complexity that demands high levels of testing and documentation. In December 2024, Health Canada published the amended Lists of Permitted Food Additives. This amendment modernizes the framework governing food additives by consolidating regulations into the lists themselves. This has added compliance costs and extended approval periods, particularly for small-scale manufacturers. The continuously changing regulatory landscape calls for constant adaptation and spending on safety controls, which serves as a disincentive to innovation and market entry. Businesses now must find a balance between innovation and compliance to remain competitive.
- Legislative restrictions on additive chemicals: Another challenge is the increasing legislative limits on individual additive chemicals due to health and environmental risks. In May 2023, Oregon passed Senate Bill 543, which bans the use of other substances in foodware containers, effective January 1, 2025. This action is likely to impact more general U.S. chemical safety revamps by raising reformulation expenses and supply chain complexity. Companies have to deal with such changing regulations without compromising product performance and competitiveness in the market.
Additives Market Size and Forecast:
| Report Attribute | Details |
|---|---|
|
Base Year |
2024 |
|
Forecast Year |
2025-2037 |
|
CAGR |
5.4% |
|
Base Year Market Size (2024) |
USD 172.1 billion |
|
Forecast Year Market Size (2037) |
USD 341 billion |
|
Regional Scope |
|
Additives Market Segmentation:
Type Segment Analysis
The polymer processing additives (PPA) segment is anticipated to hold 55% of the market share throughout the forecast period, fueled by its key role in improving polymer performance and processing efficiency. Additives enhance properties such as thermal stability, flow, and durability, which allow manufacturers to achieve high-quality and sustainability levels. In May 2024, at the NPE tradeshow, Avient highlighted its Cesa Unify A4R Polyolefin Compatibilizer and other technologies aimed at improving the use of recycled materials. The innovation aligns with the increasing demand for circular packaging solutions and regulatory pressures.
Functionality Segment Analysis
The external/surface coatings segment is anticipated to hold a 60% market share by 2037, supported by its functional role of safeguarding the packaging material and providing it with appearance. These additives impart barrier properties against moisture, oxygen, and UV radiation, improving the shelf life and quality of the product. In May 2024, at the NPE tradeshow in the U.S., Clariant launched its new AddWorks PPA product line to cater to increased demand for sustainable and health-oriented packaging solutions. The move reflects the segment's emphasis on marrying functionality with sustainability. With changing packaging norms, external coatings will continue to be an integral part for differentiation.
Our in-depth analysis of the additives market includes the following segments:
|
Segment |
Subsegments |
|
Type |
|
|
Functionality |
|

Vishnu Nair
Head - Global Business DevelopmentCustomize this report to your requirements — connect with our consultant for personalized insights and options.
Additives Market - Regional Analysis
APAC Market Insights
Asia Pacific additives market is anticipated to achieve a 45% market share during the forecast period due to industrialization, urbanization, and increasing regulatory focus on sustainability. The region is also experiencing increased consumption of bio-based and compostable additives, fueled by government support and consumer pressure. APAC's diverse market structure and increasing manufacturing base make it an optimal growth market for additives.
China additives market is expanding, backed by export growth and government policies for sustainable materials. For example, Mexico enacted a new food law in April 2024 that mandates labeling for ingredients derived from genetically modified organisms and aligns with existing front-of-package labeling requirements. Chinese manufacturers implemented the same traceability technologies to comply with global standards. China is also making R&D investments in bio-based additives and advanced functional formulations. All these are making China a world leader in sustainable additive manufacturing and innovation.
India additives market is developing robustly, with rising demand for sustainable, functional packaging materials. India has also benefited from government support for green manufacturing and circular economy concepts. India's food and beverage industry development is leading to demand for antimicrobial and UV protection additives. With local manufacturers enhancing R&D and manufacturing, India is expected to be a leading player in the global additives market in the coming years.
North America Market Insights
North America is expected to expand at a CAGR of 5.3% from 2025 to 2037, driven by strong regulatory actions and innovation in sustainable additives. Health Canada, in January 2025, demanded total transparency in additive composition, raising traceability and consumer confidence. The heightened scrutiny of food-contact additives by the U.S. FDA in March 2024 has forced businesses to adopt safer and more transparent additives. Such regulatory forces, along with rising demand for bio-based and compostable additives, are pushing a strong market environment. The region's circular economy philosophy and R&D emphasis on digitalization are pushing product development and adoption at a faster rate.
The U.S. additives market is experiencing robust growth, particularly in the animal feed additives category. Growth is driven by rising demand for nutrient-rich, functional feed additives as livestock producers respond to consumer demand for high-quality meat and dairy. Technological innovation in nutritional solutions and a shift toward green bio-based non-antibiotic additives also drive innovation and investment. The US regulatory framework, with an emphasis on food safety and green agriculture, facilitates the use of high-tech additives enhancing animal health and productivity. With food safety and sustainability at the center of US agriculture, producers are investing in increasingly traceable, environment-friendly solutions that enhance animal welfare as well as profitability in the marketplace.
Canada additives sector is expanding steadily, driven by demand for processed and convenient food. The market is driven by an intense focus on clean-label and natural ingredients, with consumers seeking healthier options and manufacturers making R&D investments in functional, allergen-free, and sustainable additives. Canada food additives market is recording strong growth in the sweeteners and preservatives categories, and rising popularity in bakery, confectionery, and beverage products. Safety and transparency are guaranteed by regulatory regimes, driving top companies to provide transparent ingredient data and make R&D investments in natural and functional additives.
Europe Market Insights
Europe is likely to record considerable growth between 2025 and 2037, driven by stringent environmental protection rules and sustainability efforts. The EU's Deforestation Regulation (EUDR) and new eco-labeling rules are driving demand for traceable, bio-based additives. In February 2025, the European Parliament and Council reached a final agreement on the PPWR, a major piece of legislation for packaging sustainability, driving circular packaging solutions. European manufacturers are making R&D investments in antimicrobial and UV protection additives to address growing health and safety requirements. These trends are leading Europe to the forefront of sustainable additive innovation and market growth.
Germany market for additives is expanding steadily, driven by its strong chemical manufacturing base and regulatory compliance. In August 2025, Germany introduced new eco-labeling rules for packaging additives, which require verified data on biodegradability. This has prompted local manufacturers to develop bio-based and compostable additives. The nation's focus on sustainable packaging and food safety is driving demand for advanced functional additives. Germany's leadership in environmental standards and R&D investment is likely to guarantee market growth and technological innovation.
The UK additives industry is poised for stable growth, fueled by increasing demand for sustainable packaging and regulation. McMaster University launched Canada's first food contact additive testing laboratory in July 2023, boosting local testing capability and facilitating environmentally friendly additive innovation. Similar developments are also underway in the UK, with increasing investment in R&D and compliance. Packaging safety and recyclability are fueling consumer awareness, and manufacturers are responding by developing innovations in bio-based and functional additives. Government policies for green chemistry and a circular economy also drive the market.
Key Additives Market Players:
- BASF SE
- Company Overview
- Business Strategy
- Key Product Offerings
- Financial Performance
- Key Performance Indicators
- Risk Analysis
- Recent Development
- Regional Presence
- SWOT Analysis
- Sika AG
- GCP Applied Technologies
- Dow Chemical Company
- Mapei S.p.A.
- Carlisle Companies Inc.
- Soprema Group
- Pidilite Industries
- Oriental Yuhong Waterproof
- Kemper System
- Saint-Gobain
- SK Global Chemical
- Nippon Paint Holdings
- Bostik (Arkema)
- Petronas Chemicals Group
- Nisshin Kogyo Co., Ltd.
- Mitsubishi Chemical Group
- Taiyo Kogyo Corporation
- Toray Industries
The additive market is highly competitive, with multinational and regional companies investing heavily in R&D, digitalization, and sustainability to lead the market. One of the recent trends observed was when BASF announced a collaboration with packaging company Metpack in May 2025 to develop and demonstrate certified home-compostable coated paper for food packaging, which would degrade within 180 days without compromising barrier performance. This follows the market trend towards high-performance, sustainable additives. Such partnerships are driving the adoption of circular economy thinking and brand value for the companies involved. As regulatory pressure and expectations from consumers continue to increase, competition will increase, further driving additive technology and sustainability gains.
Here are some leading companies in the additives market:
Recent Developments
- In September 2025, LyondellBasell commissioned a new laboratory extrusion line and upgraded a processing workshop at its Suzhou Technical Center in China. The expansion aims to support the company's Advanced Polymer Solutions (APS) business and enhance its ability to develop complex formulations for polypropylene compounds and engineered plastics.
- In August 2025, Silike introduced a new line of PFAS-free polymer processing aids (PPAs) under its SILIMER series to align with accelerating global regulatory trends against PFAS. The additives, which are based on organically modified polysiloxane, are designed for polyolefin film extrusion, including food packaging films.
- In April 2024, Westlake Corporation launched several new lower-yellowing epoxy products at the American Coatings Show in the U.S. This development demonstrates Westlake's focus on innovation in high-performance materials, offering customers better performance without needing additional additives to prevent yellowing.
- Report ID: 7914
- Published Date: Sep 23, 2025
- Report Format: PDF, PPT
- Explore a preview of key market trends and insights
- Review sample data tables and segment breakdowns
- Experience the quality of our visual data representations
- Evaluate our report structure and research methodology
- Get a glimpse of competitive landscape analysis
- Understand how regional forecasts are presented
- Assess the depth of company profiling and benchmarking
- Preview how actionable insights can support your strategy
Explore real data and analysis
Frequently Asked Questions (FAQ)
Additives Market Report Scope
Free Sample includes current and historical market size, growth trends, regional charts & tables, company profiles, segment-wise forecasts, and more.
Connect with our Expert


Copyright @ 2026 Research Nester. All Rights Reserved.
