- An Outline of the Molecular Dynamics Simulation Software Market
- Market Definition
- Market Segmentation
- Assumptions and Acronyms
- Research Methodology
- Research Process
- Primary Research
- Service Providers
- End Users
- Secondary Research
- Market Size Estimation
- Summary of the Report for Key Decision Markers
- Forces of the Market Constituents
- Factors/Drivers Impacting the Growth of the Market
- Market Trends for Better Business Practices
- Key Market Opportunities for Business Growth
- Major Roadblocks for the Market Growth
- Government Regulation
- Technology Transition and Adoption Analysis
- Industry Risk Analysis
- Global Economic Outlook: Challenges for Global Recovery and its Impact on Global Molecular Dynamics Simulation Software Market
- Ukraine-Russia Crisis
- Potential US Economic Slowdown
- Impact of COVID-19 on Global Molecular Dynamics Simulation Software Market
- Regional Analysis on Software Usage
- Industry Pricing Benchmarking & Analysis
- Industry Growth Outlook
- Industry Supply Chain Analysis
- Use Case Analysis
- Patent Analysis
- Analysis on Ongoing Technological Advancement in Molecular Dynamics Simulation Software Market
- End User Analysis
- Competitive Landscape
- Market Share Analysis, 2022
- Competitive Positioning
- Company Profile
- Schrödinger, Inc
- Siemens Digital Industries Software
- Dassault Systemes
- KTH Royal Institute of Technology
- Temple University
- University of Vienna
- Washington University in St.Louis
- Software for Chemistry & materials B.V.
- University of Illinois
- Agile Molecule
- Thermo Fisher Scientific Inc.
- D. E. Shaw Research
- Fujitsu Ltd.
- Other Players
- Global Molecular Dynamics Simulation Software Outlook & Projections, Opportunity Assessment, 2022 to 2033
- Market Overview
- Market Revenue by Value (USD Million) and Compound Annual Growth Rate (CAGR)
- Molecular Dynamics Simulation Software Segmentation Analysis 2022-2033
- By Type
- GPU-Accelerated, 2022-2033F (USD Million)
- Working Only On CPU, 2022-2033F (USD Million)
- By Application
- Chemical Research, 2022-2033F (USD Million)
- Medical Research, 2022-2033F (USD Million)
- Material Science Research, 2022-2033F (USD Million)
- Biophysics Research, 2022-2033F (USD Million)
- By End User
- Pharmaceutical Labs, 2022-2033F (USD Million)
- Research Institutes, 2022-2033F (USD Million)
- Academic Users, 2022-2033F (USD Million)
- Others, 2022-2033F (USD Million)
- By Geography
- Market Overview
- Market Revenue by Value (USD Million) and Compound Annual Growth Rate (CAGR)
- North America, 2022-2033F (USD Million)
- Europe, 2022-2033F (USD Million)
- Asia Pacific, 2022-2033F (USD Million)
- Latin America, 2022-2033F (USD Million)
- Middle East and Africa, 2022-2033F (USD Million)
- By Type
- North America Molecular Dynamics Simulation Software Outlook & Projections, Opportunity Assessment, 2022 to 2033
- Market Overview
- Market Revenue by Value (USD Million) and Compound Annual Growth Rate (CAGR)
- Molecular Dynamics Simulation Software Segmentation Analysis 2022-2033
- By Type
- GPU-Accelerated, 2022-2033F (USD Million)
- Working Only On CPU, 2022-2033F (USD Million)
- By Application
- Chemical Research, 2022-2033F (USD Million)
- Medical Research, 2022-2033F (USD Million)
- Material Science Research, 2022-2033F (USD Million)
- Biophysics Research, 2022-2033F (USD Million)
- By End User
- Pharmaceutical Labs, 2022-2033F (USD Million)
- Research Institutes, 2022-2033F (USD Million)
- Academic Users, 2022-2033F (USD Million)
- Others, 2022-2033F (USD Million)
- By Country
- US, 2022-2033F (USD Million)
- Canada, 2022-2033F (USD Million)
- By Type
- Europe Molecular Dynamics Simulation Software Outlook & Projections, Opportunity Assessment, 2022 to 2033
- Market Overview
- Market Revenue by Value (USD Million) and Compound Annual Growth Rate (CAGR)
- Molecular Dynamics Simulation Software Segmentation Analysis 2022-2033
- By Type
- By Application
- By End User
- By Country
- Germany, 2022-2033F (USD Million)
- France, 2022-2033F (USD Million)
- UK, 2022-2033F (USD Million)
- Italy, 2022-2033F (USD Million)
- Spain, 2022-2033F (USD Million)
- Netherlands, 2022-2033F (USD Million)
- Rest of Europe, 2022-2033F (USD Million)
- Asia Pacific Molecular Dynamics Simulation Software Outlook & Projections, Opportunity Assessment, 2022 to 2033
- Market Overview
- Market Revenue by Value (USD Million) and Compound Annual Growth Rate (CAGR)
- Molecular Dynamics Simulation Software Segmentation Analysis 2022-2033
- By Type
- By Application
- By End User
- Country
- China, 2022-2033F (USD Million)
- Japan, 2022-2033F (USD Million)
- India, 2022-2033F (USD Million)
- South Korea, 2022-2033F (USD Million)
- Australia, 2022-2033F (USD Million)
- Singapore, 2022-2033F (USD Million)
- Rest of Asia Pacific, 2022-2033F (USD Million)
- Latin America Molecular Dynamics Simulation Software Outlook & Projections, Opportunity Assessment, 2022 to 2033
- Market Overview
- Market Revenue by Value (USD Million) and Compound Annual Growth Rate (CAGR)
- Molecular Dynamics Simulation Software Segmentation Analysis 2022-2033
- By Type
- By Application
- By End User
- By Country
- Brazil, 2022-2033F (USD Million)
- Argentina, 2022-2033F (USD Million)
- Mexico, 2022-2033F (USD Million)
- Rest of Latin America, 2022-2033F (USD Million)
- Middle East and Africa Molecular Dynamics Simulation Software Outlook & Projections, Opportunity Assessment, 2022 to 2033
- Market Overview
- Market Revenue by Value (USD Million) and Compound Annual Growth Rate (CAGR)
- Molecular Dynamics Simulation Software Segmentation Analysis 2022-2033
- By Type
- By Application
- By End User
- By Country
- GCC, 2022-2033F (USD Million)
- Israel, 2022-2033F (USD Million)
- South Africa, 2022-2033F (USD Million)
- Rest of Middle East and Africa, 2022-2033F (USD Million)
분자 동역학 시뮬레이션 소프트웨어 시장 전망:
분자 동역학 시뮬레이션 소프트웨어 시장 규모는 2025년에 5억 5,008만 달러를 넘어섰으며, 2026년부터 2035년까지 연평균 9.7% 이상의 성장률을 기록하며 2035년에는 13억 9,000만 달러에 이를 것으로 예상됩니다. 2026년 분자 동역학 시뮬레이션 소프트웨어 산업 규모는 5억 9,810만 달러로 추정됩니다.
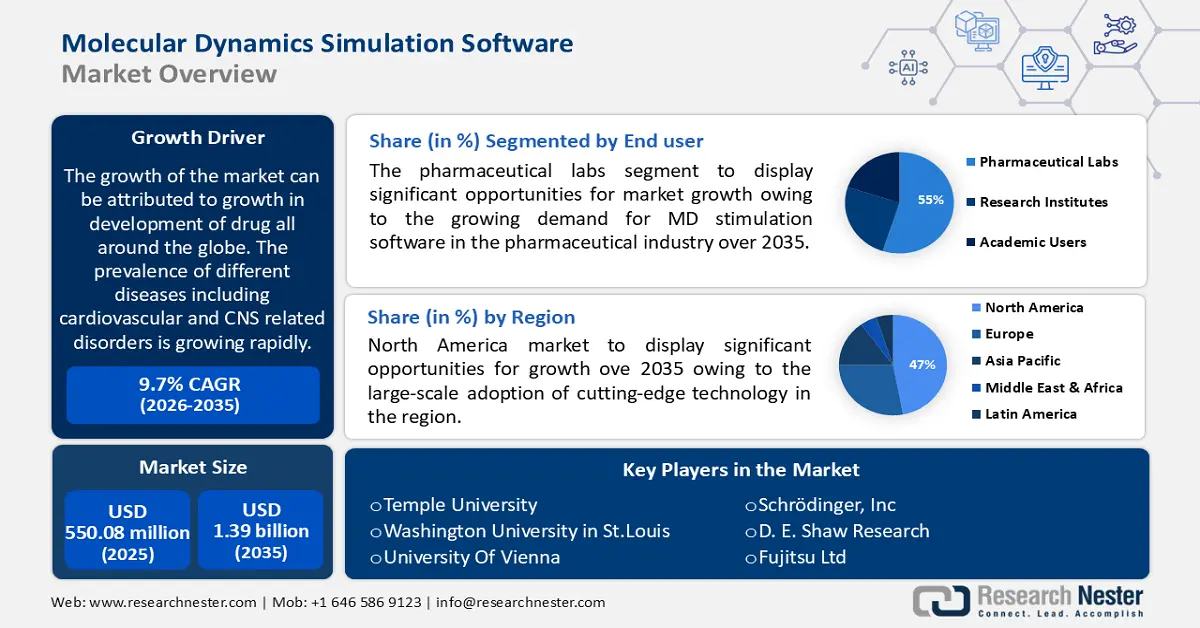
시장 성장은 전 세계적인 신약 개발 증가에 기인합니다. 심혈관 질환 및 중추신경계 질환을 비롯한 다양한 질병의 유병률이 급속히 증가하고 있습니다. 세계보건기구(WHO)에 따르면 2019년 전 세계적으로 1,790만 명이 심혈관 질환으로 사망했으며, 이는 전체 사망자의 32%에 해당합니다. 이 중 심장마비와 뇌졸중으로 인한 사망이 85%를 차지했습니다. 따라서 최적의 치료제 개발에 대한 필요성과 신약 개발의 효율성 및 투명성 향상에 대한 요구가 신약 개발 시장 성장을 견인하고 있습니다. 이러한 성장세는 분자 동역학 시뮬레이션 소프트웨어 시장의 성장을 더욱 촉진할 것으로 예상됩니다.
또한, 특히 코로나19 팬데믹 이후 정부의 신약 개발 중요성 인식 제고와 글로벌 연구 이니셔티브에 대한 자금 지원 증가가 시장 성장의 주요 요인으로 예측됩니다. 예를 들어, 인도 정부는 신약 개발 과정을 지원하기 위한 선구적인 국가적 이니셔티브인 '신약 개발 해커톤 2020(DDH2020)'을 도입했습니다. 인도 최초의 이 해커톤은 컴퓨터 과학, 화학, 약학, 의학, 기초 과학, 생명 공학 등 다양한 분야의 전문가, 학자, 연구원, 학생들을 한자리에 모았습니다. 더불어, 머신러닝은 여러 과학 분야에서 방대한 양의 데이터를 관리하고 이해하는 데 필수적인 도구로 빠르게 자리 잡았습니다. 머신러닝 모델은 복잡한 재료 특성, 의약품 개발 및 제조, 바이오시밀러 등 다양한 분야의 정확한 예측을 지원합니다. 열처리, 내성, 미세구조 모델 등 재료 모델링 및 최적화는 기존의 실험 및 이론 연구 데이터를 활용함으로써 이점을 얻을 수 있습니다. 따라서 분자 동역학 시뮬레이션에서 머신러닝 모델의 잠재력이 확대됨에 따라 시장은 수익성 있는 전망을 경험할 것으로 예상됩니다.
키 분자 동역학 시뮬레이션 소프트웨어 시장 통찰 요약:
지역별 분석:
- 2035년까지 북미는 첨단 기술의 광범위한 도입과 분자 동역학 연구에 대한 민간 자금 지원 증가에 힘입어 분자 동역학 시뮬레이션 소프트웨어 시장의 47%를 점유할 것으로 예상됩니다.
부문별 분석:
- 2026년부터 2035년까지 제약 연구소 부문은 신약 개발 수요 증가에 따른 분자 동역학 시뮬레이션 소프트웨어 수요 증가에 힘입어 연평균 10.65%라는 가장 높은 성장률을 기록할 것으로 예상됩니다.
주요 성장 추세:
- 제약 부문 연구 개발 지출 증가
- 중추신경계 관련 질환의 유병률 증가
주요 과제:
- 데이터 크기 관련 문제점
- 정보 자산 관련 과제
주요 참여 기업: Schrödinger Inc., Siemens Digital Industries Software, Dassault Systèmes, KTH Royal Institute of Technology, Temple University, Washington University in St. Louis, University of Vienna, Software for Chemistry & Materials BV, University of Illinois, Agile Molecule, Thermo Fisher Scientific Inc., DE Shaw Research, Fujitsu Ltd.
글로벌 분자 동역학 시뮬레이션 소프트웨어 시장 예측 및 지역 전망:
시장 규모 및 성장 전망:
- 2025년 시장 규모: 5억 5,008만 달러
- 2026년 시장 규모: 5억 9,810만 달러
- 예상 시장 규모: 2035년까지 13억 9천만 달러
- 성장률 전망: 9.7%
주요 지역 동향:
- 가장 큰 지역: 북미 (2035년까지 47% 점유율)
- 가장 빠르게 성장하는 지역: 유럽
- 주요 국가: 미국, 중국, 독일, 일본, 영국
- 신흥국: 인도, 한국, 싱가포르, 브라질, 호주
Last updated on : 20 November, 2025
분자 동역학 시뮬레이션 소프트웨어 시장 - 성장 동력 및 과제
성장 동력
- 제약 부문 연구 개발 지출 증가 - 2021년 전 세계 제약 부문 연구 개발에 약 2,300억 달러가 지출되었습니다. 이에 비해 2012년에는 연구 개발 지출이 약 1,300억 달러에 달했습니다. 이러한 지출은 제품 확장과 같은 점진적 혁신 개발, 신약 발견 및 테스트, 마케팅 또는 안전성 모니터링을 위한 임상 시험 등 광범위한 활동에 사용될 것으로 예상됩니다. 따라서 이러한 요인은 분자 동역학 시뮬레이션 소프트웨어에 대한 수요를 증가시킬 것으로 전망됩니다.
- 중추신경계 관련 질환의 유병률 증가 - 인도의 전체 장애보정수명(DALY)에서 비전염성 신경 질환이 차지하는 비율은 1990년 4%(95% 신뢰구간 3–2–0)에서 2019년 8%(6–6–102)로 증가했으며, 부상으로 인한 신경 질환의 비율은 2%(0–2–0)에서 0–6%(0–5–0)로 상승했습니다.
- 분자 동역학 시뮬레이션 소프트웨어 채택 급증 - 연구진은 머신러닝 기반의 새로운 기술인 심층 포텐셜 분자 동역학(DPMD)을 공개했습니다. 이 기술은 1밀리초 이상 동안 하루에 1억 개 이상의 원자 움직임을 재현할 수 있습니다.
- 임상시험 빈도 증가 - 2022년 11월 24일 기준 전 세계적으로 43만 건 이상의 임상시험이 등록되었습니다.
- AI 도입 급증 - METiS Therapeutics는 8,600만 달러 규모의 시리즈 A 투자를 유치하며 2021년 12월에 설립되었으며, 인공지능(AI)과 머신러닝을 활용하여 신약 개발 및 전달 방식을 혁신하고 생명을 위협하는 질병을 앓는 환자들에게 최상의 치료법을 제공하는 것을 목표로 합니다.
도전 과제
- 데이터 규모 문제 - 컴퓨터 시뮬레이션은 엄청난 양의 정보를 생성하기 때문에 빅데이터 관련 문제가 명백합니다. 테라바이트 규모의 궤적 데이터를 저장, 관리 및 배포하는 데 따르는 물류적 어려움은 스토리지 자원의 성능과 용량이 지속적으로 향상되고 있음에도 불구하고 여전히 존재합니다. 적어도 대부분의 생물학 분야에서는 연구 결과가 발표될 때 원본 데이터를 공개하는 것이 일반적입니다. 그러나 시뮬레이션 연구의 경우 일반적으로 그렇지 않습니다. 따라서 이러한 요인이 시장 성장을 저해할 것으로 예상됩니다.
- 정보 자산 관련 과제
- 충분한 수의 연구 자료가 부족함
분자 동역학 시뮬레이션 소프트웨어 시장 규모 및 전망:
| 보고서 속성 | 세부정보 |
|---|---|
|
기준 연도 |
2025 |
|
예측 연도 |
2026-2035 |
|
연평균 성장률 |
9.7% |
|
기준연도 시장 규모(2025년) |
5억 5,008만 달러 |
|
예측 연도 시장 규모(2035년) |
13억 9천만 달러 |
|
지역적 범위 |
|
분자 동역학 시뮬레이션 소프트웨어 시장 세분화:
전 세계 분자 동역학 시뮬레이션 소프트웨어 시장은 최종 사용자를 기준으로 제약 연구소, 연구 기관, 학계 사용자 및 기타 부문으로 세분화되어 수요와 공급 측면에서 분석됩니다. 이 중 제약 연구소 부문은 제약 산업의 분자 동역학 시뮬레이션 소프트웨어 수요 증가에 힘입어 예측 기간 동안 10.65%의 가장 높은 연평균 성장률(CAGR)을 기록할 것으로 예상됩니다. 또한 전 세계적으로 당뇨병, 알츠하이머병, 암과 같은 만성 질환 진단을 받는 사람들이 상당수 증가하고 있습니다. 예를 들어, 세계보건기구(WHO)에 따르면 전 세계적으로 4억 2,200만 명이 당뇨병을 앓고 있으며, 이들 대부분은 저소득 및 중소득 국가에 거주합니다. 당뇨병은 매년 150만 명의 사망 원인이 되고 있습니다. 따라서 신약 연구에 대한 필요성이 더욱 커지고 있습니다. 특히 제약 회사의 연구 개발 투자 비중이 높은 제약 연구소 부문에서 신약 연구 성장세가 더욱 두드러질 것으로 예상됩니다.
전 세계 분자 동역학 시뮬레이션 소프트웨어 시장은 화학 연구, 의학 연구, 재료 과학 연구, 생물 물리학 연구 등 응용 분야별로 수요와 공급 측면에서 세분화되어 분석됩니다. 이 중 의학 연구 부문은 2035년 말까지 가장 큰 매출을 창출할 것으로 예상됩니다. 이러한 성장은 의학 연구에서 분자 동역학(MD) 시뮬레이션의 활용이 증가하고 있기 때문입니다. 생의학 분야에서 분자 동역학(MD) 시뮬레이션은 돌연변이 또는 리간드 결합/해리에 의한 단백질 구조 변화를 연구하는 데 광범위하게 사용되어 왔습니다. 또한, MD 시뮬레이션은 단백질 구조의 원자 수준에서 돌연변이의 특정 영향이나 단백질-단백질/리간드 상호작용과 같이 기존의 생화학 또는 병리학 연구에서는 발견하기 어려운 다양한 관점을 제공합니다. 더욱이, 광범위한 분자 동역학(MD) 시뮬레이션의 접근성이 점점 높아지고 있으며, 신속한 신약 개발에 긍정적인 영향을 미칠 것으로 기대됩니다. 따라서 의학 연구에서 MD 시뮬레이션의 활용이 증가하고 있습니다. 하지만 재료과학 연구 부문은 예측 기간 동안 11.30%라는 가장 높은 연평균 성장률을 기록할 것으로 예상됩니다.
당사의 글로벌 분자 동역학 시뮬레이션 소프트웨어 시장에 대한 심층 분석에는 다음과 같은 부문이 포함됩니다.
유형별로 |
|
응용 프로그램별 |
|
최종 사용자에 의해 |
|

Vishnu Nair
글로벌 비즈니스 개발 책임자이 보고서를 귀하의 요구에 맞게 맞춤화하세요 — 맞춤형 인사이트와 옵션을 위해 당사의 컨설턴트와 상담하십시오.
분자 동역학 시뮬레이션 소프트웨어 시장 - 지역별 분석
북미 시장 분석
북미 제약 산업은 2035년까지 전체 매출의 47%를 차지하며 최대 성장세를 보일 것으로 예상됩니다. 이 지역 시장의 성장은 첨단 기술의 대규모 도입과 분자 동역학 연구에 대한 민간 투자 증가에 기인합니다. 또한, 북미 제약 부문의 연구 개발(R&D) 투자도 꾸준히 증가해 왔습니다. 지난 20년간 이 지역에서는 R&D 지출과 신약 출시가 급증했습니다. 제약 부문은 2019년에 연구 개발에 830억 달러를 투자했는데, 이는 인플레이션을 고려했을 때 1980년대 연평균 투자액의 약 10배에 달하는 금액입니다. 또한, 2010년에서 2019년 사이 신약 판매 허가 건수는 이전 10년 대비 60% 증가하여 2018년에는 59건으로 정점을 찍었습니다. 따라서 이러한 요인들이 북미 시장 성장을 촉진할 것으로 전망됩니다. 하지만 유럽 지역 시장은 예측 기간 동안 10.54%라는 가장 높은 연평균 성장률을 기록할 것으로 예상됩니다.

분자 동역학 시뮬레이션 소프트웨어 시장 참여 기업:
- 슈뢰딩거 주식회사
- 지멘스 디지털 인더스트리 소프트웨어
- 다쏘 시스템즈
- KTH 왕립 공과대학
- 템플 대학교
- 세인트루이스 워싱턴 대학교
- 비엔나 대학교
- 화학 및 재료 소프트웨어 BV
- 일리노이 대학교
- 민첩한 분자
- 써모 피셔 사이언티픽 주식회사
- DE 쇼 리서치
- 후지쯔 주식회사
최근 동향
시뮬레이션 독립형 검증 IP 분야의 선두 공급업체인 Avery Design Systems, Inc.가 Siemens Digital Industries Software 에 인수되는 계약을 체결했습니다. Siemens의 업계 최고 수준의 전자 설계 자동화(EDA) 집적 회로(IC) 검증 서비스 제품군은 이제 Avery의 기술을 Siemens Xcelerator 포트폴리오에 포함하게 됩니다.
다쏘시스템은 누오DB와 함께 자사가 이미 16%의 지분을 보유하고 있던 데 이어 나머지 지분도 인수한다고 발표했습니다. 2010년에 설립된 누오DB는 클라우드 네이티브 분산형 SQL 데이터베이스로, 미국 매사추세츠주 케임브리지에 본사를 두고 있으며 온디맨드 확장성, 지속적인 가용성, 트랜잭션 일관성을 제공하고 미션 크리티컬 애플리케이션에 적합하도록 설계되었습니다.
- Report ID: 3795
- Published Date: Nov 20, 2025
- Report Format: PDF, PPT
- 주요 시장 트렌드 및 인사이트 미리보기를 탐색하세요
- 샘플 데이터 테이블 및 세그먼트 분류를 검토하세요
- 시각적 데이터 표현의 품질을 경험해 보세요
- 보고서 구조 및 연구 방법론을 평가하세요
- 경쟁 환경 분석을 살짝 엿보세요
- 지역별 전망이 어떻게 제시되는지 이해하세요
- 기업 프로파일링 및 벤치마킹의 깊이를 평가하세요
- 실행 가능한 인사이트가 전략을 어떻게 지원할 수 있는지 미리 살펴보세요
실제 데이터와 분석을 탐색하세요
자주 묻는 질문 (FAQ)
분자 동역학 시뮬레이션 소프트웨어 시장 보고서 범위
무료 샘플에는 현재 및 과거 시장 규모, 성장 추세, 지역별 차트 및 표, 기업 프로필, 세그먼트별 전망 등이 포함되어 있습니다.
전문가와 상담하기


저작권 © 2026 리서치 네스터. 모든 권리 보유.
